Cryptocurrency Relative Strength Analysis Report For Week Starting 6/23/19

When you think about Cryptocurrencies, one name immediately comes to mind, Bitcoin.  Since the creation of Bitcoin, there has only ever been one cryptocurrency at the top of the market cap rankings…Bitcoin. 

When the price of Bitcoin rises, generally you can expect altcoin prices to rise with it. Likewise, when the Bitcoin price drops, altcoins also follow. And sometimes when Bitcoin is rising, the altcoins are declining due to cash moving from the altcoins to Bitcoin and vice versa.
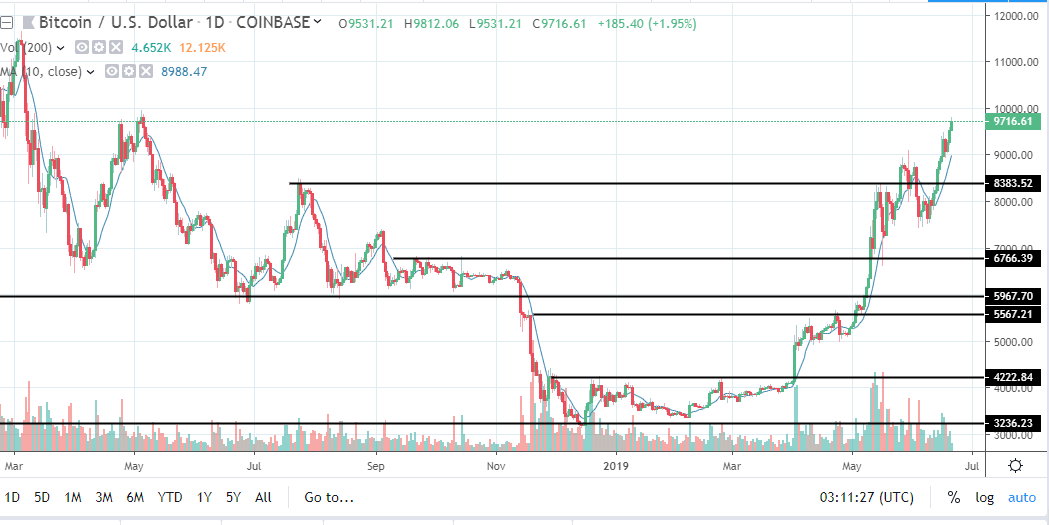
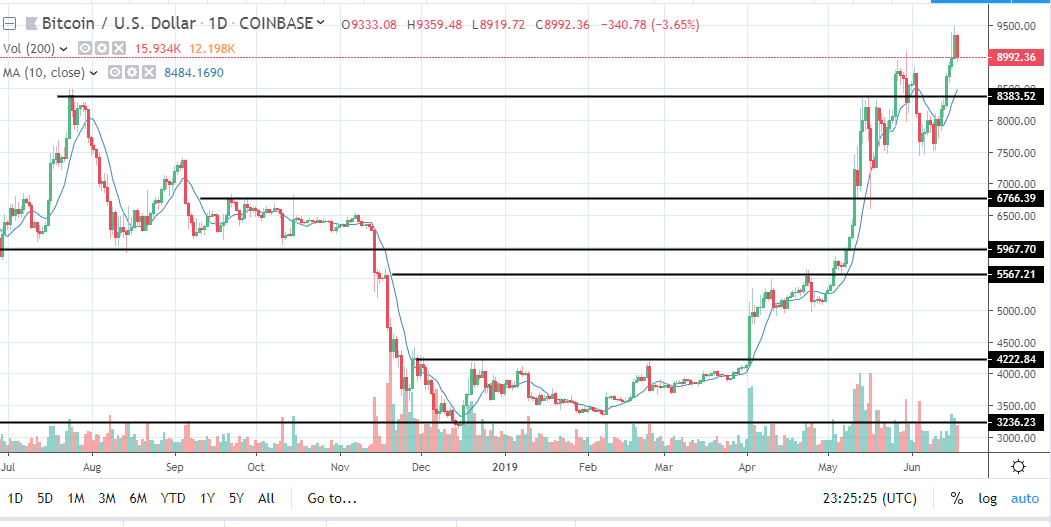
Source Image

Bitcoin dominance is used to measure the percentage of the cryptocurrency market that can be attributed to Bitcoin. Thus, it’s very easy

Bitcoin on a Long-Term View – Deja Vu?

With bitcoin flying around again one likely wonders – where will it go next?  Best way to get perspective on that is to sometimes take a step back in time.  As in the time frame you are looking at to clear the noise and see some obvious price points.
We do this by looking at the weekly chart rather than the daily.  Each candle represents a week’s worth of time and allows us to see a big picture and the levels where price reversed or bounced in the past over the course of a day or days.

Looking at the chart at

Will Mike Novogratz Be Right This Time??? – Part 3

During an interview with CNN on May 9th, Mike Novogratz published on May 9 said that he believes that $6,000 is probably a stall point, and the next one will be $10,000. I wrote about his interview about a month ago and laid out some levels to monitor en route to $10,000.

NOTE: Mike is a former Goldman Sachs partner and now represents Wall Street’s transformation to the Crypto Space.

Will Mike Novogratz Be Right This Time???

And en route to $10K, price was making demand zone after demand zone and taking out supply zones after supply zone.Thus, the chart

MITH technical analysis

MITH seen from the temporality of 1D we can see that the price has reached the zone of demand, the bulls have to get to hold this position if we want to see a pullback to the parallel channel that was broken in the previous candle, the bulls have to push strongly the price to get to claim the support of the channel and thus be able to continue rising, if not to claim the support or if the demand in 1D is not enough to hold the position is very likely to see the price fall to 160.

MITH seen

Bitcoin Pushes Toward 10K While Price Gets Overextended

Just a couple hundred points away from the big 10k.   Will it get there?  At this point it may be a self-fulfilling prophecy, but what I’m more considered about is the state of price action when it gets there.
Running to the Top of the Hill
Bitcoin has made an aggressive more higher to get near 10K and is a bit overextended as price has pulled away from the 10 day moving average (my favorite little gauge).   This doesn’t mean price cannot rip higher and go through 10K to whatever moon you are seeking.
What it does mean is that anyone buying right

EOS technical analysis

EOS seen from the temporality of 1D we can observe how the price is very close to reach the support located in the 7085, reached that point we could see three possible scenarios, the first of them would be that the price to reach the support would find strong demand that will push the candle strongly up, anyway if this happens we would have to wait for confirmation, the second scenario would be that the price to reach the support close below, if so we would have a pullback that claims support, then we would have a strong signal to

CELR technical analysis

CELR seen from the temporality of 1D we can see how the structure of candles has formed an HL (lower higher) creating in this way a symmetrical triangle in relation to the lower highs, the current candle has begun to gain momentum after the price found support in the range of 198 – 204 that I have indicated in the chart inside the blue lower rectangle, I have also indicated the important areas of supply in the upper part of achieving the break up of this setup.

CELR seen from the temporality of 4H we can observe more closely the zone

A Bitcoin Breather is in Order

After quite the move over the past week the best thing we could see from Bitcoin is some consolidation and even some backing and filling would be fine.
Digestion is a Positive
Price get away a little and become overbought so if it can bounce around the 8,800 to 9,200 level for a few days it would be healthy and let the 10 period moving average catchup, which is what I like to use for a short-term gauge of over extension.
As you can see in the chart the 10 period has been left far behind and if you look back price always

RCN technical analysis

RCN seen from the temporality of 1W we can see how the price is in range zone with a prolonged trend since April with offer against the resistance located in the 605, the price has not achieved support this level so it has continued to fall with a small take profit around 500, in this perspective the price has to keep going down, the next support is located at 256, I have also placed a lower support based on the fibonacci tool and drawn the possible trajectory that could follow the price to continue going down, waiting for a pullback

Binance Continues To Make Money Moves

Binance, one of the largest cryptocurrency exchanges by volume, is issuing a bitcoin-backed token, the firm announced in a blog post on Monday.Named BTCB, the tokens are reportedly 100% backed by bitcoins held in a reserve address, and will be issued by the exchange’s native blockchain network, Binance Chain.BTCB’s launch is part of a larger move by the exchange to boost the selection of tokens available for trading on Binance DEX, Binance’s recently-launched decentralized exchange. BTCBs will be available for trading via a BTCB/BTC trading pair on Binance’s main platform, and can then be transferred to Binance DEX for trading.“With