Crypto Contest March 21: Smartshare

Smartshare (Huobi: SSPBTC) has broken out of the triangle pattern in the daily chart.

(Chart courtesy of Tradingview.com (log scale))

Elliott Wave Analysis

In Elliott Wave terms, Smartshare began a wave one advance on November 5, 2018. The red wave one (blue sub-waves i-ii-iii-iv-v) finished on January 27 this year, and the red wave two (blue sub-waves a-b-c) correction ended on March 8. If this wave count is correct, Smartshare should be heading next towards the January 27 peak in the red wave three.

(Chart courtesy of Tradingview.com (log scale))

Funnymentals

Smartshare is a blockchain-based IoT ecosystem with 150,000 smart devices connected. You can view their official introduction video
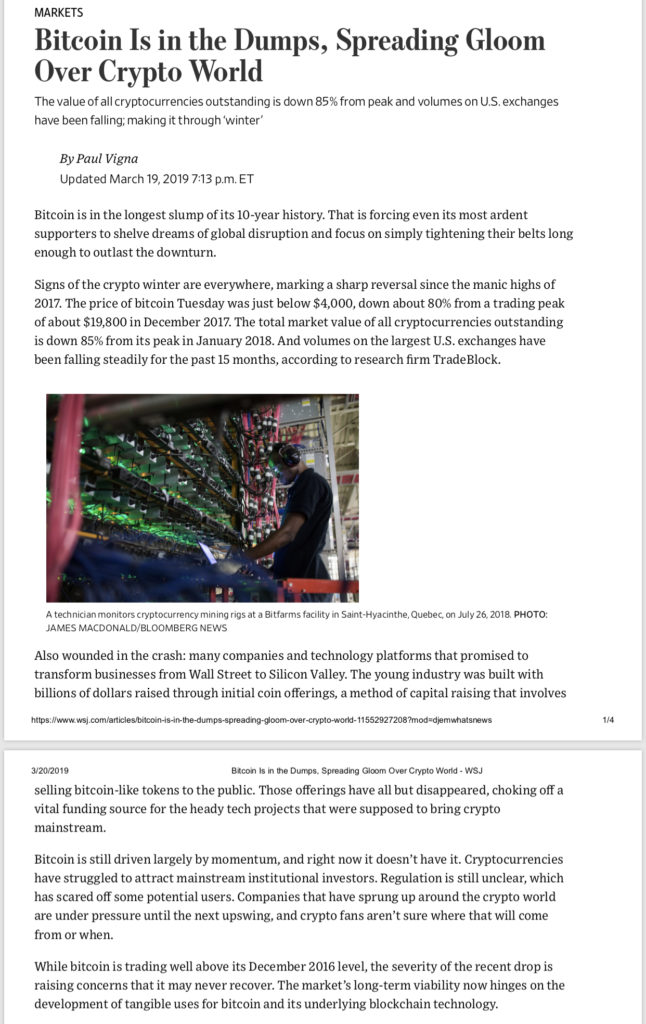

Bitcoin is in the Dumps!…

Isn’t it comical…this is the best thing about the main stream media. It gives you major turns. The mainstream media has ZERO idea what they are talking about 85% of the time. Like really Wall Street Journal? You have the audacity to write this article now? When the chart actually looks good and Bitcoin is Down 85% from highs? Lmao.

I’m not really surprised at all by this. Crypto is still in its infancy and probably inning 2 of this 9 inning game. It will come out of its 6th consecutive bottom ripping to all time highs…getcha popcorn ready. The

Bitcoin is in the Dumps!…

Isn’t it comical…this is the best thing about the main stream media. It gives you major turns. The mainstream media has ZERO idea what they are talking about 85% of the time. Like really Wall Street Journal? You have the audacity to write this article now? When the chart actually looks good and Bitcoin is Down 85% from highs? Lmao.

I’m not really surprised at all by this. Crypto is still in its infancy and probably inning 2 of this 9 inning game. It will come out of its 6th consecutive bottom ripping to all time highs…getcha popcorn ready. The

Crypto Contest March 20: LinkEye

LinkEye (Huobi: LETUSDT) has broken out of the triangle pattern in the four-hour chart.

(Chart courtesy of Tradingview.com (log scale))

Elliott Wave Analysis

In Elliott Wave terms, LinkEye began a wave one advance on January 28 this year. The red wave one finished on February 24, and the red wave two correction ended on March 4. The red wave three advance finished on March 10, and the red wave four correction ended on March 14. If this wave count is correct, LinkEye should be heading next towards the March 10 peak in the red wave five.

(Chart courtesy of Tradingview.com (log scale))

Zooming out in the daily chart,

Crypto Contest March 19: Achain

Achain (Huobi: ACTUSDT) has broken out of the triangle pattern in the daily chart.

(Chart courtesy of Tradingview.com (log scale))

Elliott Wave Analysis

In Elliott Wave terms, Achain began a wave one advance on January 11 this year. The red wave one finished on January 13, and the red wave two correction ended on January 28. The red wave three advance finished on February 23, and the red wave four correction ended on March 11. If this wave count is correct, Achain should be heading next towards the February 23 peak in the red wave five.

(Chart courtesy of Tradingview.com (log scale))

Funnymentals

Achain is a public blockchain

Crypto Contest March 18: BitTorrent

BitTorrent (Binance: BTTUSDT) has broken out of the triangle pattern in the daily chart.

(Chart courtesy of Tradingview.com (log scale))

Elliott Wave Analysis

In Elliott Wave terms, BitTorrent began a wave one advance on January 31 this year. The red wave one (blue sub-waves i-ii-iii-iv-v) finished on February 5, and the red wave two (blue sub-waves a-b-c) correction ended on March 8. If this wave count is correct, BitTorrent should be heading next towards the February 5 peak in the red wave three.

(Chart courtesy of Tradingview.com (log scale))

Funnymentals

BitTorrent aims to tokenize the decentralized file-sharing protocol with their cryptocurrency asset. You can find some more details from

New Weekly Candle: And the Show Goes On!

We have a new crypto week on our hands. And anyone with half a non emotional trading brain can look st the charts and know “the show goes on” baby!

Litecoin Ian leading the way and I have been on this for a few weeks hitting it dead nuts . I may have been struggling a little with equities, but I love crypto more anyways . Good luck out there! My favorites…

BTC

BAT

EOS

LTC

Crypto Contest March 17: SmartMesh

SmartMesh (Huobi: SMTETH) has broken out of the triangle pattern in the weekly chart.

(Chart courtesy of Tradingview.com (log scale))

Elliott Wave Analysis

In Elliott Wave terms, SmartMesh began a wave one advance in December 2017. The red wave one (blue sub-waves i-ii-iii-iv-v) finished in January 2018, and the red wave two (blue sub-waves a-b-c) correction ended in December 2018. If this wave count is correct, SmartMesh should be heading next towards the January 2018 peak in the red wave three.

(Chart courtesy of Tradingview.com (log scale))

Funnymentals

SmartMesh will build P2P mesh networks that run parallel to the international Internet based on intelligent hardware, software and protocols. You

Crypto Contest March 16: GoChain

GoChain (Binance: GOBTC) has broken out of the triangle pattern in the daily chart.

(Chart courtesy of Tradingview.com (log scale))

Elliott Wave Analysis

In Elliott Wave terms, GoChain began a wave one advance on October 12, 2018. The red wave one (blue sub-waves i-ii-iii-iv-v) finished on November 12, 2018, and the red wave two (blue sub-waves a-b-c) correction ended on February 20 this year. If this wave count is correct, GoChain should be heading next towards the November 2018 peak in the red wave three.

(Chart courtesy of Tradingview.com (log scale))

Funnymentals

GoChain is a scalable, high performance, low cost, and decentralized cryptocurrency and blockchain that supports

Crypto Contest March 15: Lisk

Lisk (Bittrex: LSKUSD) has broken out of the triangle pattern in the weekly chart.

(Chart courtesy of Tradingview.com (log scale))

Elliott Wave Analysis

In Elliott Wave terms, Lisk began a wave one advance in October 2016. The red wave one (blue sub-waves i-ii-iii-iv-v) finished in January 2018, and the red wave two (blue sub-waves a-b-c) correction ended in February this year. If this wave count is correct, Lisk should be heading next towards the January 2018 peak in the red wave three.

(Chart courtesy of Tradingview.com (log scale))

Funnymentals

Lisk will make it easy for developers to build and deploy decentralized applications in JavaScript. You can view their
