BITCOIN

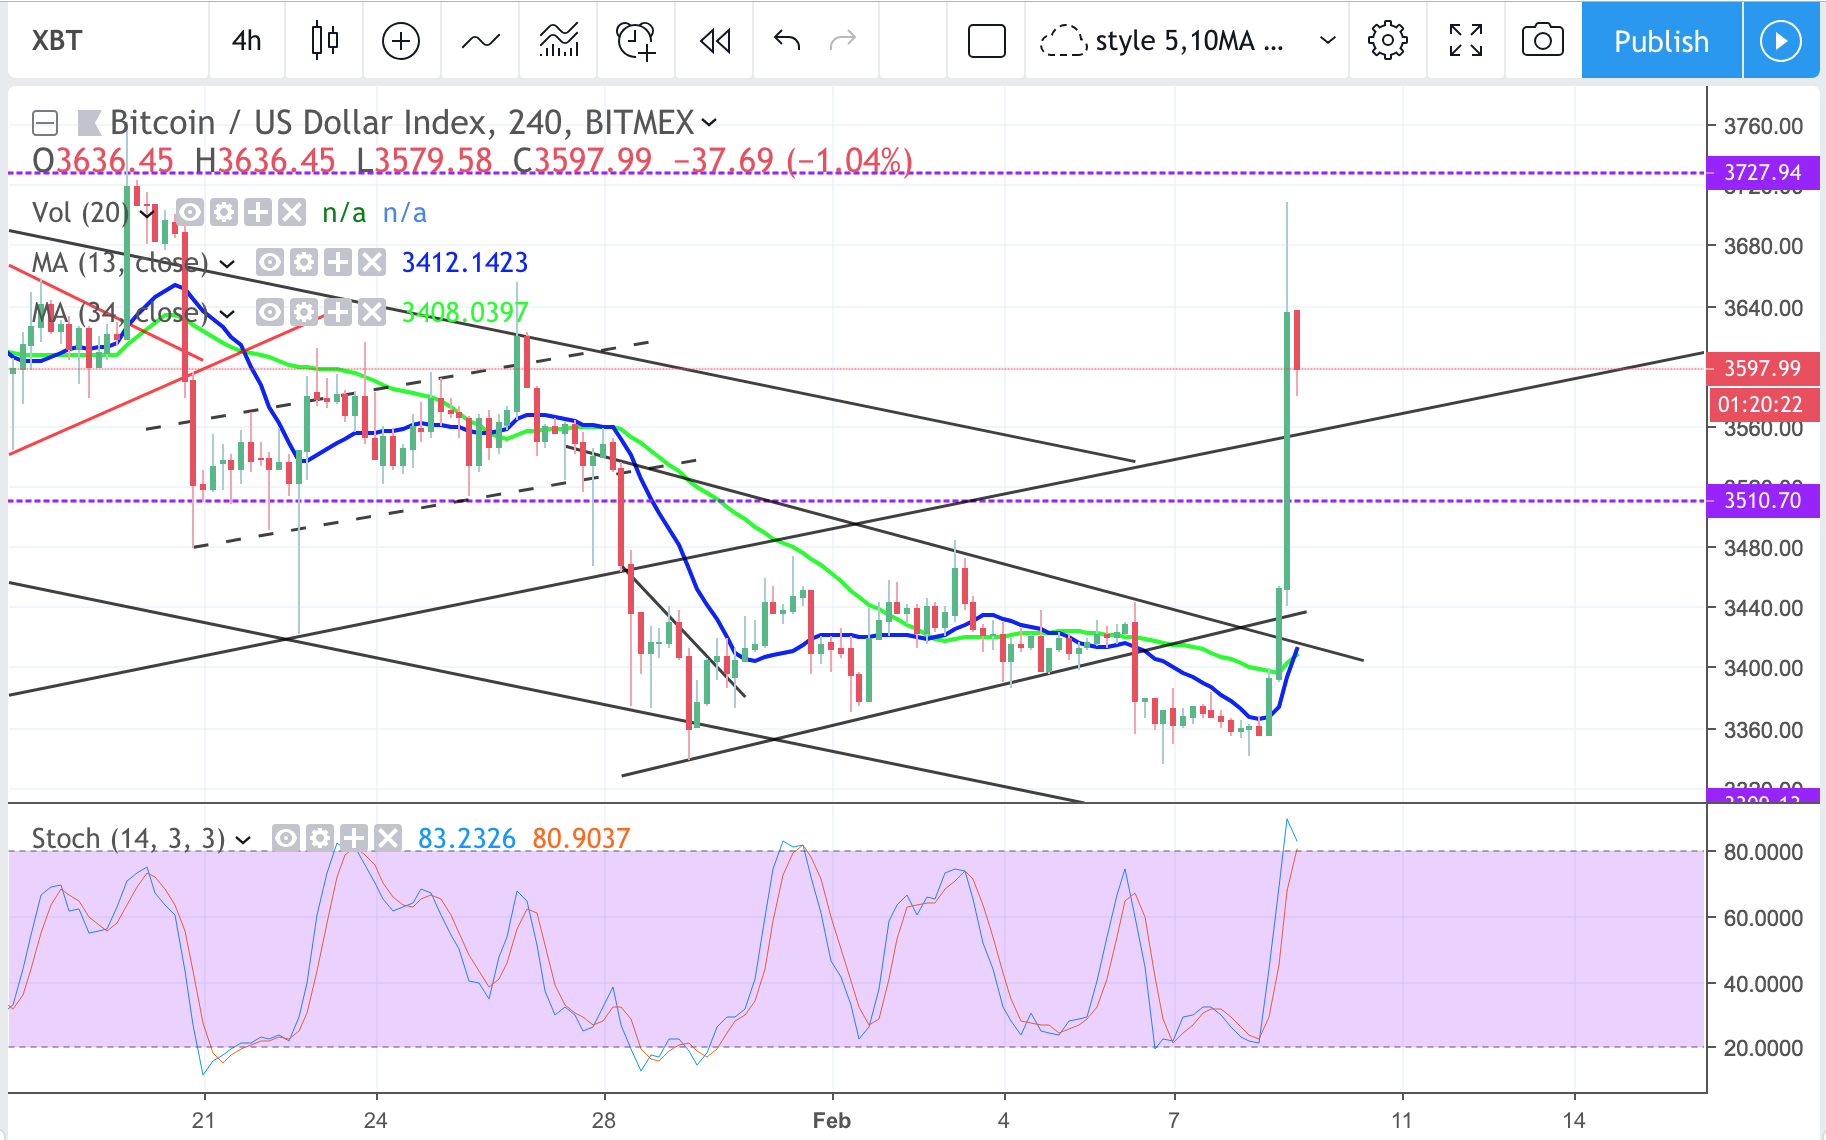
The news probably caused the spike a little and trigger some short squeeze fuelling the 300+ pts surge. Mentioned in previous post of testing the 3300 zone support then bouncing but didn’t expect it to shoot up so high 300+. Likely to cooldown after the news tampered down. Possible test of 3500 support zone and making a push for big channel top resistance around + horizontal resistance around 3720 zone.
News: (Current) https://cointelegraph.com/news/sec-commissioner-jackson-thinks-regulator-will-approve-btc-etf-leaked-interview-shows  | (Upcoming)
Short term moving average (day candle) :
RSI :
Network Value to Transactions Ratio :130
Total marketcap :120
Dominance :53
Bitfinex Margin Long/Short Volume Ratio :
Depth Chart : (S) | (R)
Weekly Timeframe
Crypto Rips Higher – $EOS Spikes 17%, $LTC 30%+

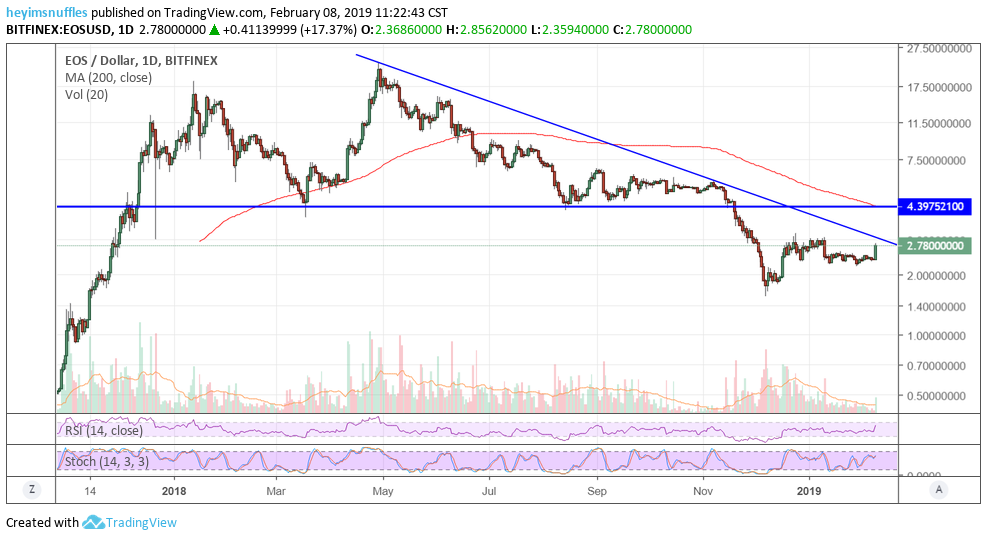
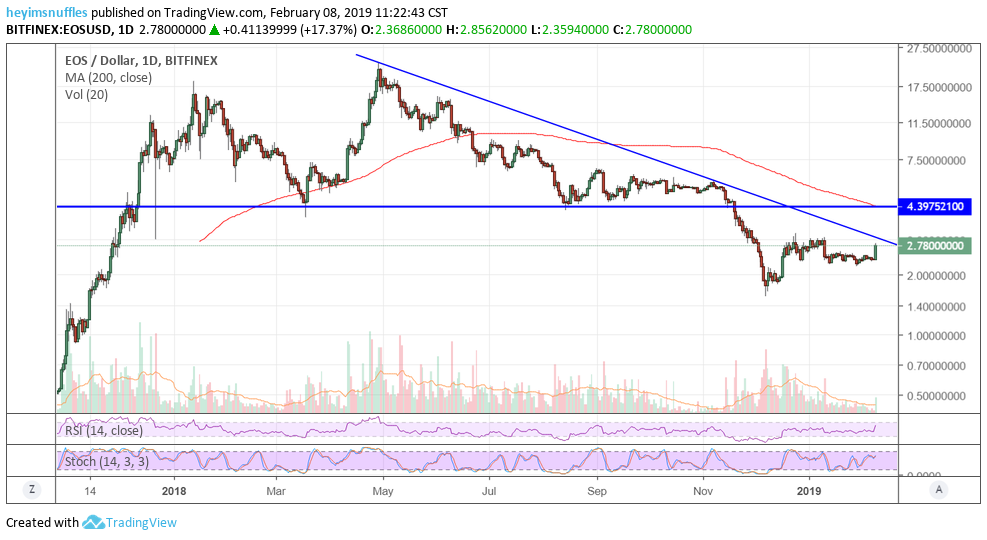
Crypto has awoken. About 2 hours ago after slowly creeping higher and higher, crypto has spiked. EOS and LTC are two that are really ripping higher as they have been the ones that have shown relative strength. Below is the chart of EOS and you can see, if this day holds, this may be quite the igniting bar to start a trend reversal higher in the intermediate term.

Believe me, there is A lot of work left to be done and this work will be done through TIME or PRICE. This is the first step and you can see that taking

Crypto Rips Higher – $EOS Spikes 17%, $LTC 30%+

Crypto has awoken. About 2 hours ago after slowly creeping higher and higher, crypto has spiked. EOS and LTC are two that are really ripping higher as they have been the ones that have shown relative strength. Below is the chart of EOS and you can see, if this day holds, this may be quite the igniting bar to start a trend reversal higher in the intermediate term.

Believe me, there is A lot of work left to be done and this work will be done through TIME or PRICE. This is the first step and you can see that taking

Crypto Contest February 8: Ethereum

Ethereum (Kraken: ETHUSD) has broken out of the triangle pattern in the daily chart.

(Chart courtesy of Tradingview.com (log scale))
Elliott Wave Analysis
In Elliott Wave terms, Ether began a wave one advance on December 14, 2018. The red wave one (blue sub-waves i-ii-iii-iv-v) finished on January 5 this year, and the red wave two (blue sub-waves a-b-c) correction ended on February 6. If this wave count is correct, Ether should be heading next towards the January 5 peak in the red wave three.

(Chart courtesy of Tradingview.com (log scale))
Looking at the monthly chart, I believe Ether is currently in the red wave five.

Crypto Contest February 8: Ethereum

Ethereum (Kraken: ETHUSD) has broken out of the triangle pattern in the daily chart.

(Chart courtesy of Tradingview.com (log scale))
Elliott Wave Analysis
In Elliott Wave terms, Ether began a wave one advance on December 14, 2018. The red wave one (blue sub-waves i-ii-iii-iv-v) finished on January 5 this year, and the red wave two (blue sub-waves a-b-c) correction ended on February 6. If this wave count is correct, Ether should be heading next towards the January 5 peak in the red wave three.

(Chart courtesy of Tradingview.com (log scale))
Looking at the monthly chart, I believe Ether is currently in the red wave five.

BITCOIN

Seem like it’s going for the 4th leg down within the mini channel, likely to test 3300 support zone. Possible bounce of the support zone or the previous low of 3100 zone to form maybe a double bottom W pattern. Feb tends to end off bullish.
News: (Current) | (Upcoming)
Short term moving average (day candle) :
RSI :
Network Value to Transactions Ratio :130
Total marketcap :111
Dominance :53.4
Bitfinex Margin Long/Short Volume Ratio :
Depth Chart : (S) | (R)
Weekly Timeframe :
—
#### Recommended
►You’re gonna post on instagram, youtube, twitter anyway, why not post and earn steem : https://share2steem.io/
►Walk, Jog, Run and Earn steem for moving :

BITCOIN

Going for the 4th leg down likely to test 3300 support may even test for 3120 for a possible double bottom W pattern on 4hr chart. Feb tends to close off bullish.
News: (Current) | (Upcoming)
Short term moving average (day candle) :
RSI :
Network Value to Transactions Ratio :130
Total marketcap :111
Dominance :53.4
Bitfinex Margin Long/Short Volume Ratio :
Depth Chart : (S) | (R)
Weekly Timeframe :
—
#### Recommended
►Play and Earn steem, blockchain Trading Card Game : https://steemmonsters.com
►You’re gonna post on instagram anyway, post and earn steem : https://share2steem.io/
►Walk, Jog, Run and Earn steem for moving : https://actifit.io
►Sell your upvotes automatically : https://smartsteem.com
#### Dark Side Secrets
►Play

4th of July fireworks?

I swear that date is coincidental – though I’ll be that first to admit that it is conveniently useful!
From https://pixabay.com/en/new-year-s-eve-fireworks-beacon-1953253/ ; by nickgesell

First things first
I’m laying my bull flag theory to rest. It was nice while it lasted, but that “flag” has now become far too long, too tapered and too low down relative to the “flagpole” which preceded it. Ergo – it isn’t a bull flag. This means that the post “BTC 29 Jan – still on track” is now invalid.
BTC may have been on track, but now it’s derailed. It is still in the same channel (previously called

Crypto Contest February 7: Vertcoin

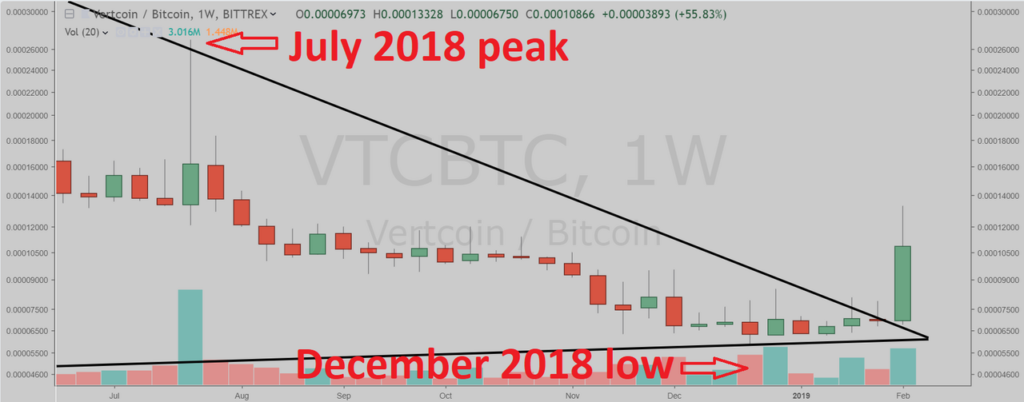
Vertcoin (Bittrex: VTCBTC) has broken out of the triangle pattern in the weekly chart.

(Chart courtesy of Tradingview.com (log scale))
Elliott Wave Analysis
In Elliott Wave terms, Vertcoin began a wave one advance in November 2016. The red wave one (blue sub-waves i-ii-iii-iv-v) finished in October 2017, and the red wave two (blue sub-waves a-b-c) correction ended in December 2018. If this wave count is correct, Vertcoin should be heading next towards the October 2017 peak in the red wave three.

(Chart courtesy of Tradingview.com (log scale))
Looking at the monthly chart, I believe Vertcoin is currently in the red wave three (blue sub-wave iii).

Crypto Contest February 7: Vertcoin

Vertcoin (Bittrex: VTCBTC) has broken out of the triangle pattern in the weekly chart.

(Chart courtesy of Tradingview.com (log scale))
Elliott Wave Analysis
In Elliott Wave terms, Vertcoin began a wave one advance in November 2016. The red wave one (blue sub-waves i-ii-iii-iv-v) finished in October 2017, and the red wave two (blue sub-waves a-b-c) correction ended in December 2018. If this wave count is correct, Vertcoin should be heading next towards the October 2017 peak in the red wave three.

(Chart courtesy of Tradingview.com (log scale))
Looking at the monthly chart, I believe Vertcoin is currently in the red wave three (blue sub-wave iii).