Bitcoin and general tips

 
This won’t be a long-post, I have some “Crypto Housekeeping” to do.
It occurred to me that my housekeeping itself may be of value to my readers, so I’m quickly going to run through it with you. But first let’s look at the big names:
Metals and BTC:
Yesterday I spoke about a precious metals breakout. My criterion for the confirmation of a Gold breakout WAS met! Now I wish I had had more money to put into Gold earlier this year! The other precious metals I discussed also performed well yesterday – it looks like they may finally regain their rightful prices.
 

Made
Crypto Contest June 21: Telcoin

Telcoin (HitBTC: TELETH) has broken out of the triangle pattern in the daily chart.

(Chart courtesy of Tradingview.com (log scale))

Elliott Wave Analysis

In Elliott Wave terms, Telcoin began a wave one advance on February 21. The red wave one (blue sub-waves i-ii-iii-iv-v) finished on March 30, and the red wave two (blue sub-waves a-b-c) correction ended on June 17. If this wave count is correct, Telcoin should be heading next towards the March 30 peak in the red wave three.

(Chart courtesy of Tradingview.com (log scale))

Funnymentals

Telcoin connects existing mobile money platforms to the decentralized financial system of the future, beginning with a globally marketed remittance service

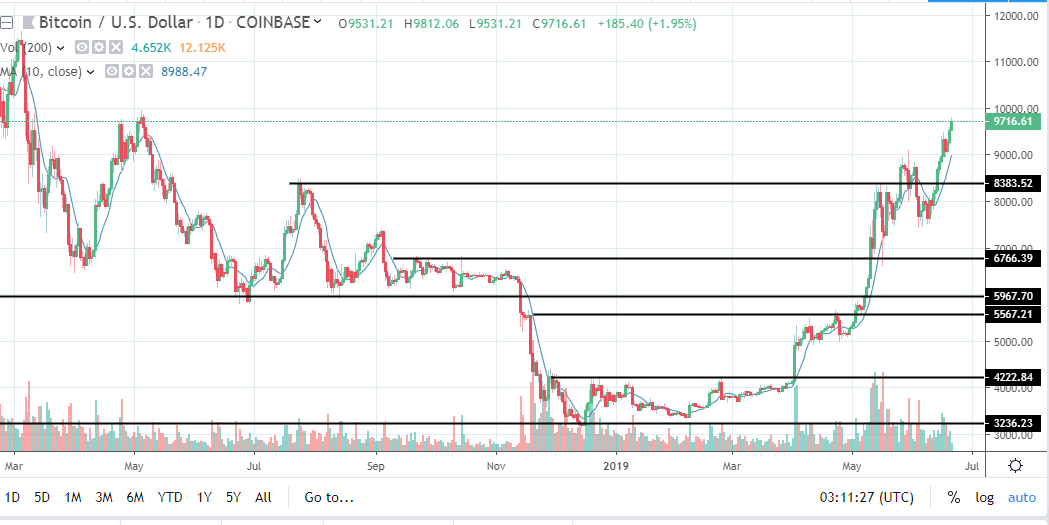
Bitcoin Pushes Toward 10K While Price Gets Overextended

Just a couple hundred points away from the big 10k.   Will it get there?  At this point it may be a self-fulfilling prophecy, but what I’m more considered about is the state of price action when it gets there.
Running to the Top of the Hill
Bitcoin has made an aggressive more higher to get near 10K and is a bit overextended as price has pulled away from the 10 day moving average (my favorite little gauge).   This doesn’t mean price cannot rip higher and go through 10K to whatever moon you are seeking.
What it does mean is that anyone buying right

Two Minute Crypto – Riding the Bull (Part 4 of 5)

Please click the link below to listen to the 42nd episode of my weekly crypto podcast ‘Two Minute Crypto.’ These are intended to be short, single-topic ramblings on some aspect of the cryptosphere. Comments and critiques welcome.

External Podcast Links

https://podcasts.apple.com/au/podcast/two-minute-crypto-riding-the-bull-part-4-of-5/id1441492450?i=1000442145126

or

https://www.podbean.com/eu/pb-wwbn3-b5339d

Transcript

Two Minute Crypto – Riding the Bull (Part 4 of 5)

Welcome to Two Minute Crypto and part four of ‘Riding
the Bull’. To date in this series, we’ve looked at the importance of establishing
reliable sources of crypto-related information, the need for planning market
engagement and the role that a coherent rule-set and the exercise of discipline
play in achieving sustainable returns.

Next, we turn our attention

EOS technical analysis

EOS seen from the temporality of 1D we can observe how the price is very close to reach the support located in the 7085, reached that point we could see three possible scenarios, the first of them would be that the price to reach the support would find strong demand that will push the candle strongly up, anyway if this happens we would have to wait for confirmation, the second scenario would be that the price to reach the support close below, if so we would have a pullback that claims support, then we would have a strong signal to

BITCOIN – 20 Jun

On 4hr chart, on track for 9600 zone to test the channel top resistance. Will it test 10k ? or maybe it will repeat the previous smaller channel pattern, testing the channel top and breakout upside for the 3 leg ? Limited upside likely. Weekly looking very parabolic.
News: (Current) | (Upcoming)
Short term moving average (day candle) :
RSI :
Network Value to Transactions Ratio :
Total marketcap :
Dominance :
Bitfinex Margin Long/Short Volume Ratio :
Depth Chart : (S) | (R)
Weekly Timeframe :

Is Bitcoin Preparing for a Breakout?

Bitcoin seems to have confirmed a bullish ascending triangle pattern. That does suggest a break up, targeting approximately $9,750. This doesn’t mean it’s definitely going to break up. We know bitcoin has a history of painting bullish or bearish patterns, only to lure in guppies and take price in the opposite direction. Regardless, probability is in favor of a bullish break up to at least $9,600-$9,700. Volume remains lackluster as traders wait for confirmation of a larger move. I think that larger move will likely come in the next 48 hours.

Zooming out to a more macro level, we can see

Crypto Contest June 20: Centrality

Centrality (HitBTC: CENNZBTC) has broken out of the triangle pattern in the daily chart.

(Chart courtesy of Tradingview.com (log scale))

Elliott Wave Analysis

In Elliott Wave terms, Centrality began a wave one advance on March 10. The red wave one (blue sub-waves i-ii-iii-iv-v) finished on April 15, and the red wave two (blue sub-waves a-b-c) correction ended on June 10. If this wave count is correct, Centrality should be heading next towards the April 15 peak in the red wave three.

(Chart courtesy of Tradingview.com (log scale))

Funnymentals

Centrality is a blockchain platform and venture studio business based in Auckland New Zealand, with offices in 4 countries around the

CELR technical analysis

CELR seen from the temporality of 1D we can see how the structure of candles has formed an HL (lower higher) creating in this way a symmetrical triangle in relation to the lower highs, the current candle has begun to gain momentum after the price found support in the range of 198 – 204 that I have indicated in the chart inside the blue lower rectangle, I have also indicated the important areas of supply in the upper part of achieving the break up of this setup.

CELR seen from the temporality of 4H we can observe more closely the zone

BITCOIN – 19 Jun

On 4hr chart, looks like its finding support on the MA/8800 zone, Likely to cling on and head to test 9600 lvl around the channel top resistance. NVT rising up, possible pullback ahead after hitting the 9600 level.
News: (Current) | (Upcoming)
Short term moving average (day candle) :
RSI :
Network Value to Transactions Ratio :127
Total marketcap :285
Dominance :56.8
Bitfinex Margin Long/Short Volume Ratio :
Depth Chart : (S) | (R)
Weekly Timeframe :
