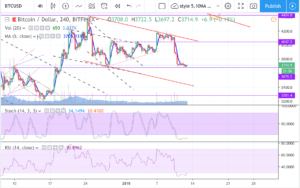
On 4hr chart, looks like 3680 support still holding, next move position building up while it consolidate. More bias for downside move toward the channel bottom around 3400 also the 3rd leg of the staircase pattern.
News: (Current) | (Upcoming)
Short term moving average (day candle) :
RSI :
Network Value to Transactions Ratio :138
Total marketcap :122
Dominance :52.4
Bitfinex Margin Long/Short Volume Ratio :
Depth Chart : (S) | (R)
Weekly Timeframe :
Tag: Cryptocurrencies
Bitcoin and EOS Technical Analysis: WEEKEND UPDATE
Bitcoin is consolidating right on top of the $3,600 support zone. Should price decisively break below $3,600, the next relevant area of support is between $3,400 and $3,250.
In my last EOS update, I pointed out the larger wedge it was consolidating in. I told you it would likely make a larger move as EOS approached the apex. The following day, price broke down from $3.00 to as low as $2.30. It then sightly rallied to the $2.45 support zone. EOS continues trading around $2.45 at the time of writing this update.
In today’s video analysis I discuss, where prices may be
Crypto Contest January 12: Status
Status (Bittrex: SNTBTC) has broken out of the triangle pattern in the weekly chart.
(Chart courtesy of Tradingview.com (log scale))
Elliott Wave Analysis
In Elliott Wave terms, Status began a wave one advance in December 2017. The red wave one (blue sub-waves i-ii-iii-iv-v) finished in January 2018, and the red wave two (blue sub-waves a-b-c) correction ended in December 2018. If this wave count is correct, Status should be heading next towards the January 2018 peak in the red wave three.
(Chart courtesy of Tradingview.com (log scale))
Funnymentals
Status is an open source messaging platform and mobile interface to interact with decentralized applications that run on
BITCOIN: Stick to the plan
Bearish Flag, as expected. Ready for the decisive movement? Elliot Waves and volume indicates a lower low…
Currently correcting and forming wave 4… it must be already completed…
I have bought some at (3) and I sold it at (d)… if the count is fine we are going close to the next FIBO level (3367 USD)…
Plan entries again around that point and crossing fingers for the count to be right and, if not… a proper stop loss just a little below…
Take care and enjoy!
@toofasteddie
*Disclaimer: This is just my personal point of view, please, do your own assessment and act consequently. Neither this
Read
BITCOIN – possible down channel
Looks like 3680 support zone is still holding, will there be a 3rd leg from the staircase pattern ? Possible down channel which 3rd leg might test channel bottom around 3400 support zone. Both stoch and RSI on 4hr chart over extended, probably need some very limited oscillation up before there’s room to move lower.
News: (Current) | (Upcoming)
Short term moving average (day candle) :
RSI :
Network Value to Transactions Ratio :138
Total marketcap :123
Dominance :52.3
Bitfinex Margin Long/Short Volume Ratio :
Depth Chart : (S) | (R)
Weekly Timeframe :
Read More
Does Bitcoin Hold Here?
After attempting to put in an intermediate bottom pattern and rallying (somewhat) off the lows, this is the time to be watching. DOES BITCOIN GET BOUGHT in the next few days? This is the first major SELL day after the rally and I am curious if buyers are going to step in…
Do we see the 3600 buyers step in and put some pressure on the sellers? My gut reaction is we do and see the rally to the 200 day MA…however that was quite the Sell day after the failed break up 3 days ago. 3600-4200 is the range but
Crypto Contest January 11: Ontology
Ontology (Binance: ONTBTC) has broken out of the triangle pattern in the daily chart.
(Chart courtesy of Tradingview.com (log scale))
Elliott Wave
Read More
BITCOIN: The Moment of the Truth
Again, we are reaching the moment on which BEARS and BULLS fight among themselves, the first to keep dragging the market, the Second to reverse it…
Since Christmas I have been talking about this movement, a 5-3-5 Correction, also called Zig-Zag correction.
The movement has been performed exactly as expected, despite the time it has taken to get completed…
LEG A: 5 waves down, reaching the 81.8 Fibonacci’s LevelLEG B: A-B-C subwaves within a long bearish FlagLEG C: 5 Waves Down, completed or almost completed. BTC has touched the “A” level but, normally, this kind of corrections can go a little bit lower…perhaps
Read
Bitcoin Technical Analysis: THE BEARS HIT BACK
In my last update, I warned market makers may push price down to liquidate long positions. We had longs stacked and shorts falling off with extremely low volume. This was all a recipe for at least a temporary drop in price. Today we saw that happen as price dropped from $4,050 to as low as $3,750. It’s currently trading around $3,780 on Coinbase.
Looking at the daily chart, we can see price found support right on top of the 50 Day MA. If it decisively breaks below, I think a drop to at least $3,600 will become likely.
While some long positions
BITCOIN – possible staircase down pattern start | been busy with newborn next stage of life
Looks like the from the last post, limited upside was valid. These kind of sudden up then consolidate and sudden down really traps ppl. On 4hr possible start of staircase pattern down. Next good support around 3680 again. On daily chart, looks like a possible horizontal consolidation between 3680 and 4200 maybe until mid/end of jan for spike to test the long term bearish channel top resistance around 4400 but 3680 must hold first.
PS : Been away for the past few days for my newborn, entering new stage of life =)
News: (Current) | (Upcoming)
Short term moving average (day candle) :
RSI


