BITCOIN: This is the EW count on play…

I have to make reference here to my post published on January 15th, called “BITCOIN: Current Possibilities”.

There, I planned two scenarios, depending if the 5th wave was already completed or not…

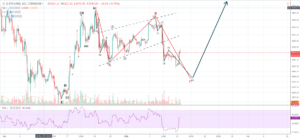
Well, what it seems now is that the previous 4th wave formation has lasted 5 days to complete and what we are seeing right now is the final 5th wave down…as an extended wave.

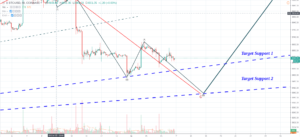
The target support 1 has been crossed by the price, reaching resistance at the same level of wave (3) and creating a double bottom which is a good sign of recovery but, the (5)th wave down

When a Bullish Market?

…or better said, by when the reversal will be confirmed?

Honestly, I do not know with certainty but I can share with you what I think are really good and simple tools to assess this point:

The Crypto Total Market Cap, in a Daily timeframeThe 200 DMA lineThe “Volume Flow Indicator” by LazyBear

Essentially, the Market is in a Bearish Trend when, the 200 DMA keeps located above “Total Market candle Line” and the “Volume Flow Indicator” [VFI] keeps below the “0” line separating two scenarios.

So, to confirm the reversal trend we should have to see first, an “approach” of the “VFI”

BITCOIN: Triangular formation…

Remember my post yesterday and my main Two Possibilities … Should I reconsider those scenarios ? Well, you have always to review and control the Plan, however, I have to say that both possibilities are still valid but one is taking more chances to be correct…

Today, BITCOIN has been drawing a nice Triangular Pattern, One spike up (b), another one down, repeating the same level…(a), (c).

Currently another green candle seems defining the (d)…

Breakage of the triangle usually happens on (e) but it can also happen on (d) as well so, we have to pay attention to the action of Bitcoin

BITCOIN: Current Possibilities

Two Target supports, two different alternatives…

Assumption: Extended 5th still on going

Last 5th wave of the down-cycle may be composed by 5 subwaves (Brown). First wave (very long IMO) and 2nd wave completed… 3rd wave on going…

Target limit 3375 USD (Target support 2)

Assumption: 5th wave completed

1st wave (brown) up completed, building the 2nd… If BTC rebounds on the “Target support 1” around 3537 USD then the EW count is valid and the 3rd wave upwards will be formed…

Entry Target: 3540 after rebounding on the support 1.

@toofasteddie

*Disclaimer: This is just my personal point of view, please, do your own assessment and act consequently. Neither this

BITCOIN: Two possibilities, same result…

As explained yesterday… currently there are a lot of chances that the end of the correction has not been reached, and so, there may be a last move downwards in order to terminate the 5th wave down.

BITCOIN is now approaching the first target support on which I would expect some hesitance but, in order to complete the 5th wave down, I think there is a high likelihood of reaching a lower price than the one reached by the 3rd wave.

Using FIBONACCI Levels, right now BTC is touching the 61.8% of total retracement but, as you can see, does not seem

BITCOIN: Is the correction finished?

…and the answer is also difficult.

I see two possibilities now at the 4 hour-chart.

The first one: with the last drop, BITCOIN has reached the 5th wave bottom, end of the ZIG-ZAG correction…

3rd wave longer than 1st and 5th… 5th wave short but within the expectations, since “C” is just below “A” Leg… From now on, we should see 5 waves towards the “Target Resistance” in dashed Blue line.

If BTC manages to break that resistance it would be a very good signal of Reversal…

2nd Option (among others, of course…): The assumption would be that still the 4th wave is in play

BITCOIN: Testing and old resistance

Early yesterday we saw a sudden drop of the BITCOIN price followed by a short and shy consolidation movement upwards…

The drop was expected since the Elliot Wave count was alerting about that in order to complete a long 5-3-5 Correction…

The question is, does the drop terminated? It may have been terminated, actually it looks like a very short but probable 5th wave…

In order to know it we have to see how BITCOIN manage in front of the next resistance:

The RSI indicates oversold condition but the Constant Low Volume does not bode high hopes for recovery…

My plan keeps alive, for the

BITCOIN: Bye Bye to iHS…

…but only for the moment

What we are contemplating now is the “building” of the last leg of the correction, which I expected since a week ago…

The question for me now is how deep BTC will fall in order to complete the “C” leg…

As I am stick to the plan that this is indeed a 5-3-5 Zig-Zag correction, the “C” leg should finish than the “A”, which finished at 61.8 Fibonacci’s Level…

So for the “C” I would expect a “Healthy” price corresponding to the next FIBO Level (78.6%) which is 3367 USD.

Let’s “sail” the new stream

@toofasteddie

*Disclaimer: This is just

BITCOIN: Hesitance and Low Volume

Still volume so small, drawing what is seems to be a shy bull flag after the 5 minutes move upwards yesterday…

Someone may say that is Bullish signal, some may say that it has been only a “manipulation” movement willing to trigger the upwards constant move but…it seems to be only a few big buying orders willing to move the market indeed…

We are still far from being out of danger despite BTC is moving above the 50 EMA oat the 4h-chart…

I’m still considering a final move upwards before correcting long down…

Remember, two options, either BTC crosses the “Neckline” of the inverted

BITCOIN: Symmetrical Triangle broken by the upper side

As forecasted yesterday, we have obtained a breakage of the symmetrical triangle as soon as BTC has reached the APEX.

Now, we may see again two possibilities, as you can see we are always “Binary” and prioritizing still a Bearish trend in opposition to declare a reversal confirmed:

First and primary option, for me, the “Famous” 5-3-5 correction on play:

According to this assumption, we would be still attending the “building” of a plausible 5-3-5 Zig-Zag correction since the pattern is valid. So, in this case, BITCOIN may still reach a value slightly below the last high (see wave (V)) or 4237 USD