Steem Price: That Bearish U-Turn Came to Fruition

A few days back I mentioned how the price of steem formed a bearish u-turn pattern on the daily chart after testing that 40 cent area.
The volume was weak on it so I thought, maybe it won’t play out.
Unfortunately the Bear Roared

The gold circle from my original chart points out the bearish u-turn pattern marked by the reversal candle (first red candle of the past six red days) and the pattern has played out with the following sell off.
Possible downside targets are the 25 cent level that acted as a bottom on the past two little pull backs.
Conclusion
What this basically

Steem Price: That Bearish U-Turn Came to Fruition

A few days back I mentioned how the price of steem formed a bearish u-turn pattern on the daily chart after testing that 40 cent area.
The volume was weak on it so I thought, maybe it won’t play out.
Unfortunately the Bear Roared

The gold circle from my original chart points out the bearish u-turn pattern marked by the reversal candle (first red candle of the past six red days) and the pattern has played out with the following sell off.
Possible downside targets are the 25 cent level that acted as a bottom on the past two little pull backs.
Conclusion
What this basically
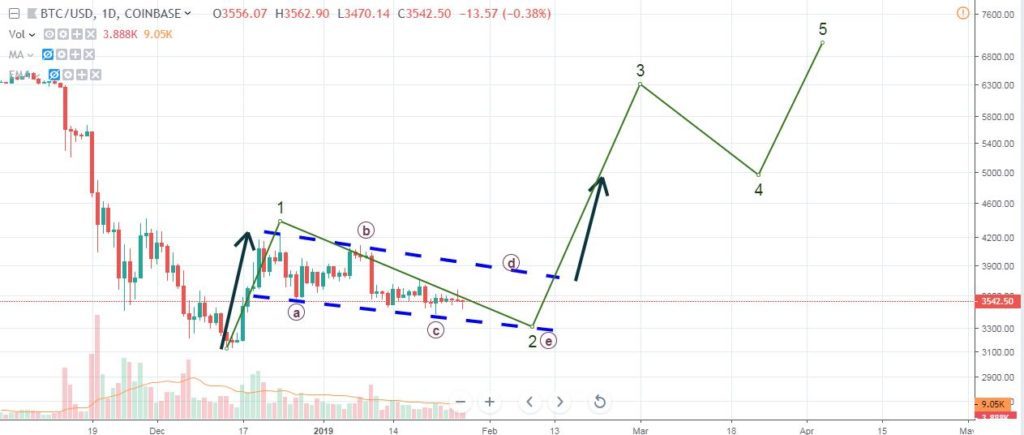
BITCOIN: another possibility…

With such a tiny volume is being really difficult to find any indication that show us the next move of BITCOIN and so, the direction of the Market.

The positive view now is that BITCOIN is still within the correction of a first wave within an upwards cycle…hopefully.

BITCOIN may be forming just a long Bull-flag, ending the wave 2 as I show you below:

Breakage of this Bull-flag upwards could be on (d) or after rebounding on (e)…

The upper Dashed line is marking the limit… we have to pay attention to that line because it is very likely that BTC has already

BITCOIN: another possibility…

With such a tiny volume is being really difficult to find any indication that show us the next move of BITCOIN and so, the direction of the Market.
The positive view now is that BITCOIN is still within the correction of a first wave within an upwards cycle…hopefully.
BITCOIN may be forming just a long Bull-flag, ending the wave 2 as I show you below:

Breakage of this Bull-flag upwards could be on (d) or after rebounding on (e)…
The upper Dashed line is marking the limit… we have to pay attention to that line because it is very likely that BTC has already

Did EOS just release the name of its’ Steemit 2.0? $EOS #eos #steem

Rumor circulating around that the new social network built on top of the EOS blockchain is going to be called…
MEOS
Does anyone have ay more information on this and what it is suppose to be like? We all knew Dan was working on another social site, but is this the one he was talking about? If you know of anything I am missing leave it in the comments!
Thanks

What actually matters in the Cryptocurrency Evolution

Cryptocurrency is the next internet. Most of us heavily involved, or trying to get heavily involved, in crypto application and dApps know this. We are the believers. The 2% in my opinion. After the most recent bubble, the public is just now starting to figure out that Crypto is the real deal (and believe me there are still many doubters) and the tipping point was made.
The Question is, how do you find the real winners that will change the world?
What you want to be looking for is projects being used in real life applications. What projects are actually being utilized

BITCOIN

And indeed it tested the bottom of the channel, let see if there will be a bounce. On hourly chart, possible bounce ahead maybe light one. NVT getting up again not good., might even head to test bottom of big symmetrical triangle again which 3450 must hold for triangle to stay valid.
News: (Current) | (Upcoming)
Short term moving average (day candle) :
RSI :
Network Value to Transactions Ratio :130
Total marketcap :118
Dominance :52.7
Bitfinex Margin Long/Short Volume Ratio :
Depth Chart : (S) | (R)
Weekly Timeframe :

Crypto Contest January 27: Pal Network

Pal Network (Bittrex: PALBTC) has broken out of the triangle pattern in the daily chart.

(Chart courtesy of Tradingview.com (log scale))
Elliott Wave Analysis
In Elliott Wave terms, Pal Network began a wave one advance on November 25, 2018. The red wave one (blue sub-waves i-ii-iii-iv-v) finished on December 28, 2018, and the red wave two (blue sub-waves a-b-c) correction ended on January 25 this year. If this wave count is correct, Pal Network should be heading next towards the December 28, 2018 peak in the red wave three.

(Chart courtesy of Tradingview.com (log scale))
Funnymentals
Pal Network is decentralizing insurance. BlockchainBrad interviewed the CEO back in November

The Sunday Recap -Down the Rabbit Hole 13

Hectic week, there are reams of tweets and articles strewn on the cutting floor. However, if there was one key personal take away from this week in crypto, it would be that smart contracts have a very long way to go before being fully ready for widespread business adoption. Truthfully, I thought we were further along but having listened to the CEO of Chainlink discuss the current state of play I’ve had to reset my expectations for smart contract deployment in the broader economy. It will still happen but further out.
I also found myself re-evaluating the status and role of

BITCOIN – Mini breakout come back to test

On 4hr chart pullback testing the mini ascending triangle breakout 3580 zone. Might head down to test channel bottom around 3520 as margin shorts are picking up. As long as the channel bottom holds, still valid for short up trend.
News: (Current) | (Upcoming)
Short term moving average (day candle) :
RSI :
Network Value to Transactions Ratio :118
Total marketcap :120
Dominance :52.4
Bitfinex Margin Long/Short Volume Ratio :
Depth Chart : (S) | (R)
Weekly Timeframe :
