Technical Analysis for Bitcoin, EOS, ETH and XRP: BRIEF OVERVIEW

Bitcoin has broken back below $3,400 (Coinbase).

EOS is hovering around $2.27 (Bitfinex) and seems to be eyeing the $2.11 support.

Ethereum is sitting on the $100 phycological support. If that support breaks decisively, we could see it fall as low as $80.

Ripple (XRP) looks to be operating within a descending wedge. While this is a bullish pattern, it may get worse before it gets better.

In today’s video analysis I discuss, traps to avoid, where prices may be heading next and so much more. I hope you find it helpful.
Video Analysis:

 
If you don’t see the above video, navigate to TIMM (https://mentormarket.io/workin/) or
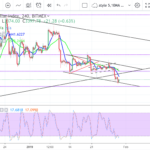
BITCOIN – channel bottom light bounce

Channel bottom light bounce valid as mentioned from previous post, margin shorts still picking up. On 4hr chart, light bounce might continue to test resistance zone 3436. Possible mini slant W pattern which might breakout to test the resistance of the big triangle bottom which now become the resistance.
News: (Current) | (Upcoming)
Short term moving average (day candle) :
RSI :
Network Value to Transactions Ratio :130
Total marketcap :113
Dominance :53.4
Bitfinex Margin Long/Short Volume Ratio :
Depth Chart : (S) | (R)
Weekly Timeframe :

Crypto Contest January 29: IoTeX

IoTeX (Binance: IOTXETH) has broken out of the triangle pattern in the daily chart.

(Chart courtesy of Tradingview.com (log scale))
Elliott Wave Analysis
In Elliott Wave terms, IoTeX began a wave one advance on August 15, 2018. The red wave one (blue sub-waves i-ii-iii-iv-v) finished on October 28, 2018, and the red wave two (blue sub-waves a-b-c) correction ended on January 5 this year. If this wave count is correct, IoTeX should be heading next towards the October 28, 2018 peak in the red wave three.

(Chart courtesy of Tradingview.com (log scale))
Funnymentals
IoTeX is a privacy-centric blockchain platform that is fast, flexible and Internet of Things (IoT) friendly. You

Technical Analysis for Bitcoin: Quick Update

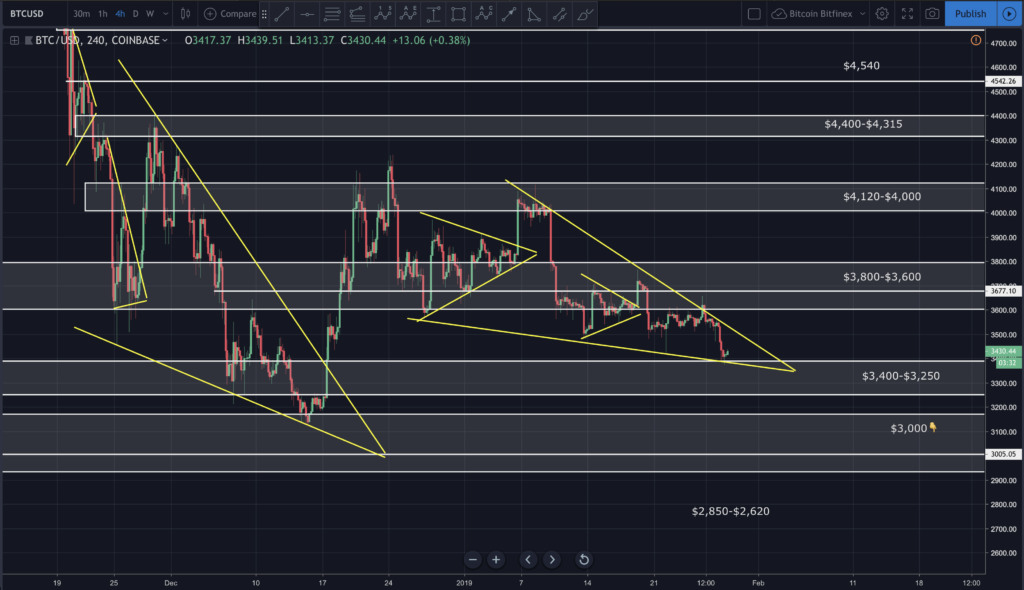
Bitcoin finally broke down below the $3,500 support it’s been hovering on for the last 2 weeks. It dropped to the known $3,400 support and is currently trading around $3,430.

Looking at the daily chart we can see bitcoin bounced right off the bottom Bollinger band.

In today’s video analysis I discuss, where price maybe heading next, traps to avoid and so much more. I hope you find it helpful.
Video Analysis:


If you don’t see the above video, navigate to TIMM (https://mentormarket.io/workin/) or Steemit in order to watch.
I hope this has been helpful. I’d be happy to answer any questions in the comment

Technical Analysis for Bitcoin: Quick Update

Bitcoin finally broke down below the $3,500 support it’s been hovering on for the last 2 weeks. It dropped to the known $3,400 support and is currently trading around $3,430.

Looking at the daily chart we can see bitcoin bounced right off the bottom Bollinger band.

In today’s video analysis I discuss, where price maybe heading next, traps to avoid and so much more. I hope you find it helpful.
Video Analysis:


If you don’t see the above video, navigate to TIMM (https://mentormarket.io/workin/) or Steemit in order to watch.

I hope this has been helpful. I’d be happy to answer any questions in the comment

BITCOIN: Bullish Divergence at the 4h-chart

Another low today, as expected, within the two lines which define the Bull-flag.

BITCOIN touched the lower support of the Bull flag and have entered inside the “Oversold” area of the RSI at the 4h-chart.

The good new is that RSI indication of the last two lows shows a divergence. When prices make lower lows but the oscillator(MACD or RSI are good ones) make higher lows it means just one thing, Next move must be upwards or, better said, it is a Bullish Divergence.

RSI Oscillator

MACD Oscillator

If you enter now (3400 USD), always considering that the upper dashed line is the “resistance” ,

BITCOIN: Bullish Divergence at the 4h-chart

Another low today, as expected, within the two lines which define the Bull-flag.
BITCOIN touched the lower support of the Bull flag and have entered inside the “Oversold” area of the RSI at the 4h-chart.
The good new is that RSI indication of the last two lows shows a divergence. When prices make lower lows but the oscillator(MACD or RSI are good ones) make higher lows it means just one thing, Next move must be upwards or, better said, it is a Bullish Divergence.
RSI Oscillator

MACD Oscillator

If you enter now (3400 USD), always considering that the upper dashed line is the “resistance” ,

BITCOIN – New recent low

As mentioned yesterday, it may test the bottom of triangle bottom and indeed it happened and went lower. Let see if the day candle have strength push back and close off the candle above the triangle bottom near 3465 zone. On 4hr chart possible new down channel. Margin shorts picking up.
News: (Current) | (Upcoming)
Short term moving average (day candle) :
RSI :
Network Value to Transactions Ratio : 130
Total marketcap : 113
Dominance : 53.6
Bitfinex Margin Long/Short Volume Ratio :
Depth Chart : (S) | (R)
Weekly Timeframe :

Crypto Contest January 28: Dent

Dent (Binance: DENTETH) has broken out of the triangle pattern in the daily chart.

(Chart courtesy of Tradingview.com (log scale))
Elliott Wave Analysis
In Elliott Wave terms, Dent began a wave one advance on August 6, 2018. The red wave one (blue sub-waves i-ii-iii-iv-v) finished on October 30, 2018, and the red wave two (blue sub-waves a-b-c) correction ended on January 2 this year. If this wave count is correct, Dent should be heading next towards the October 30, 2018 peak in the red wave three.

(Chart courtesy of Tradingview.com (log scale))
Funnymentals
Dent is tokenizing the mobile data industry and creating a world-wide marketplace to

3 Reasons I Remain Long-term Bullish on Bitcoin

This marks the inaugural post of the ‘Three Reasons’ series. The posts will alternate – a bullish outlook for a particular blockchain project followed by a bearish. Three is an estimate of convenience only.  These posts are intended to be brief expressions of my opinion on particular cryptocurrencies and are not exhaustive in detail.
3 Reasons I Remain Long-term Bullish on BTC
The 2020 Halvening
In May 2020 the block reward for BTC will go from 12.5 BTC per block to 6.25 effectively halving the rate of inflation and new coin supply. In the months before and after this drop in supply creation, it is
