Lowes Suffered A Major Mishap After Announcing Earnings

Lowes announced mixed first-quarter 2019 results and reduced its full-year outlook yesterday sending the stock down double digits, its worst one-day stock plunge since 1992.

The good news was Lowe’s quarterly sales grew 2.2% year over year, to $17.74 billion with a 3.5% increase in comparable-store sales.  The bad news was Lowe’s revised its 2019 earnings per share outlook downward to a range of $5.45 to $5.65, from a previous range of $6 to $6.10 because they failed to raise prices in time to make up for higher costs.

What happened, according to Ellison, is this: Essentially, Lowe’s merchandising executives were
Crypto Contest May 23: Blockparty

Blockparty (Bittrex: BOXXBTC) has broken out of the triangle pattern in the daily chart.

(Chart courtesy of Tradingview.com (log scale))

Elliott Wave Analysis

In Elliott Wave terms, Blockparty began a wave one advance on January 13. The red wave one (blue sub-waves i-ii-iii-iv-v) finished on March 18, and the red wave two (blue sub-waves a-b-c) correction ended on May 13. If this wave count is correct, Blockparty should be heading next towards the March 18 peak in the red wave three.

(Chart courtesy of Tradingview.com (log scale))

Funnymentals

Blockparty is an event ticketing blockchain platform. You can watch their latest AMA below.

https://youtu.be/h3zbeasTj-A

(Sources: Blockparty and YouTube)

How can I vote? Where

Crypto Contest May 22: Everipedia

Everipedia (Bitfinex: IQXUSD) has broken out of the triangle pattern in the daily chart.

(Chart courtesy of Tradingview.com (log scale))

Elliott Wave Analysis

In Elliott Wave terms, Everipedia began a wave one advance on February 6. The red wave one (blue sub-waves i-ii-iii-iv-v) finished on April 16, and the red wave two (blue sub-waves a-b-c) correction ended on May 14. If this wave count is correct, Everipedia should be heading next towards the April 16 peak in the red wave three.

(Chart courtesy of Tradingview.com (log scale))

Funnymentals

Everipedia’s IQ Network is an encyclopedia that allows anyone to become a stakeholder in the system and earn rank, rewards & tokens for

Crypto Contest May 21: SunContract

SunContract (Huobi: SNCBTC) has broken out of the triangle pattern in the daily chart.

(Chart courtesy of Tradingview.com (log scale))

Elliott Wave Analysis

In Elliott Wave terms, SunContract began a wave one leading diagonal advance on December 12, 2018. The red wave one finished on December 29, 2018, and the red wave two correction ended on January 29 this year. The red wave three (blue sub-waves i-ii-iii-iv-v) advance finished on April 8, and the red wave four (blue sub-waves a-b-c) correction ended on May 14. If this wave count is correct, SunContract should be heading next towards the April 8 peak in the red wave five.

(Chart

Steem Price Rally – Keeps on Passing Me By

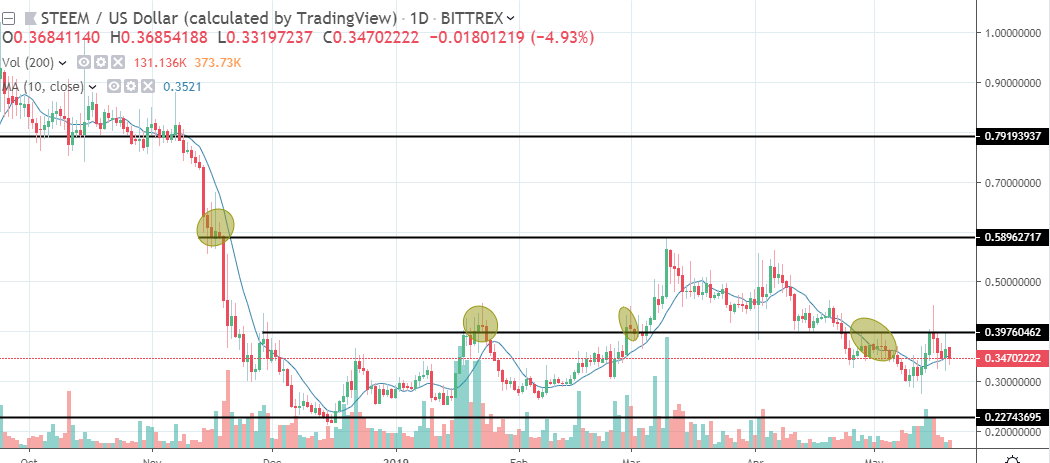
Does something count as a rally if it doesn’t breakout above it’s nearest resistance level?
The Alt Rally That Wasn’t?
So after BTC ripped we did see a small alt rally, especially in the larger cap coins like ETH, LTC, EOS and even XRP.
All of these coins pushed higher out of the ranges they had been stuck in.  Unfortunately STEEM did not do the same.
Looking at the chart in the post you can see we saw a little price rally for a few days that tested the 40 cents resistance area only to get smacked down.
Disappointing indeed, but atleast it made a

Crypto Contest May 20: Tripio

Tripio (Huobi: TRIOBTC) has broken out of the triangle pattern in the daily chart.

(Chart courtesy of Tradingview.com (log scale))

Elliott Wave Analysis

In Elliott Wave terms, Tripio began a wave one advance on January 29. The red wave one (blue sub-waves i-ii-iii-iv-v) finished on April 7, and the red wave two (blue sub-waves a-b-c) correction ended on May 12. If this wave count is correct, Tripio should be heading next towards the April 7 peak in the red wave three.

(Chart courtesy of Tradingview.com (log scale))

Zooming out in the daily chart, I believe Tripio is currently in the red wave three (blue sub-wave iii). The red

Bitcoin Testing Recent Highs Already

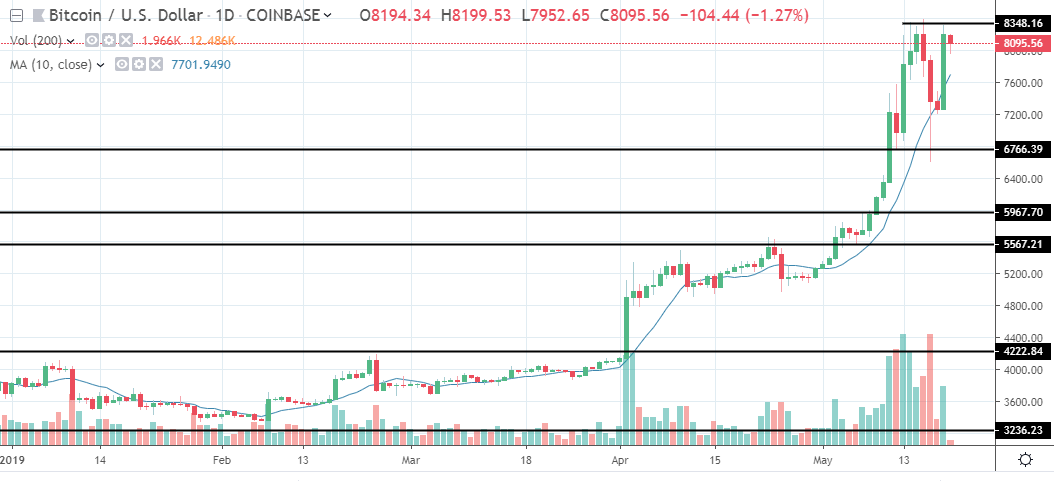
After getting what was an expected pullback and seeing price briefly spike down to the 6800 area support BTC has rallied to test the recent high.
A Big Green Candle – One and Done?
The daily candle that just closed an hour ago was a big one as buyers swooped in and pushed prices back higher.  Volume wasn’t as high as the up days from early in the week, but it was still above average.
Whether this bounce has legs is to be seen but we know what the first upside hurdle is that is for sure.
Looking at the chart in this post

Crypto Contest May 19: Newton

Newton (Huobi: NEWUSDT) has broken out of the triangle pattern in the daily chart.

(Chart courtesy of Tradingview.com (log scale))

Elliott Wave Analysis

In Elliott Wave terms, Newton began a wave one advance on April 16. The red wave one (blue sub-waves i-ii-iii-iv-v) finished on April 19, and the red wave two (blue sub-waves a-b-c) correction ended on May 15. If this wave count is correct, Newton should be heading next towards the April 19 peak in the red wave three.

(Chart courtesy of Tradingview.com (log scale))

Funnymentals

Newton Project aims to build infrastructure for a community-based economy through the provision of services around governance, collaboration, and incentives. You

Forex Relative Strength Analysis Report For Week Starting 5/19/19

Some of the world’s currencies are accepted for most international transactions. The most popular currencies are accepted for most international transactions are the U.S. dollar, the euro, and the yen. However, the U.S. dollar is the most popular. And in the foreign exchange market 90 of forex trading involves the U.S. dollar.  Thus, when assessing the relative strength of the most popular currencies in the world, it’s always against the U.S. dollar, using the daily time frame chart.

The “major” forex currency pairs are the major countries that are paired with the U.S. dollar (the nicknames of the majors are in

Crypto Contest May 18: Pundi X

Pundi X (Binance: NPXSUSD) has broken out of the triangle pattern in the daily chart.

(Chart courtesy of Tradingview.com (log scale))

Elliott Wave Analysis

In Elliott Wave terms, Pundi X began a wave one advance on December 28, 2018. The red wave one (blue sub-waves i-ii-iii-iv-v) finished on April 6 this year, and the red wave two (blue sub-waves a-b-c) correction ended on May 14. If this wave count is correct, Pundi X should be heading next towards the April 6 peak in the red wave three.

(Chart courtesy of Tradingview.com (log scale))

Funnymentals

Pundi X is a developer of blockchain-powered devices, including a point-of-sale solution, XPOS, which enables