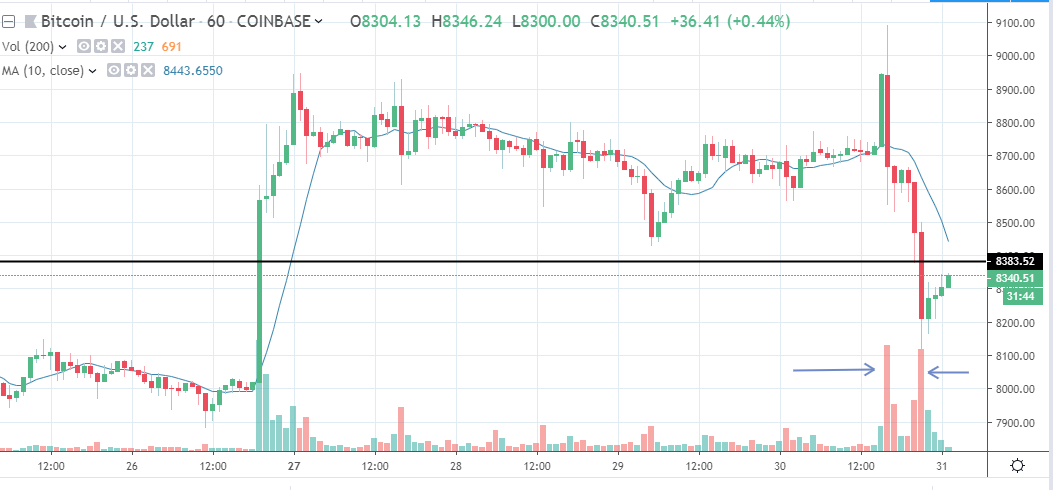
Anyone who was watching today so a heck of a price swing out of BTC. Price pushed through 9,000 only to give it back minutes later to begin a near-term sell off.
Shaking Weak Hands?
Many people have theories about candles like these, they press through a commonly watched level to trigger buy or sell orders only to whip right back in the expected direction.
Look at the hourly chart I have posted here. That first big volume big body red candle is a clear indication of that. Anyone who was short BTC using the most recent high as their stop got owned
Tag: money
Crypto Contest May 30: FairGame
FairGame (Huobi: FAIRBTC) has broken out of the triangle pattern in the daily chart.
(Chart courtesy of Tradingview.com (log scale))
Elliott Wave Analysis
In Elliott Wave terms, FairGame began a wave one advance on February 19. The red wave one (blue sub-waves i-ii-iii-iv-v) finished on April 8, and the red wave two (blue sub-waves a-b-c) correction ended on May 14. If this wave count is correct, FairGame should be heading next towards the April 8 peak in the red wave three.
(Chart courtesy of Tradingview.com (log scale))
Funnymentals
FairGame is a fair game platform based on blockchain technology. You can read their latest weekly report here.
(Sources: FairGame and Medium)
How can
Crypto Contest May 29: Themis
Themis (Huobi: GETBTC) has broken out of the triangle pattern in the daily chart.
(Chart courtesy of Tradingview.com (log scale))
Elliott Wave Analysis
In Elliott Wave terms, Themis began a wave one advance on February 21. The red wave one (blue sub-waves i-ii-iii-iv-v) finished on April 5, and the red wave two (blue sub-waves a-b-c) correction ended on April 27. If this wave count is correct, Themis should be heading next towards the April 5 peak in the red wave three.
(Chart courtesy of Tradingview.com (log scale))
Funnymentals
Themis is a blockchain-based fair exchange system for digital currencies, providing a decentralised escrow service for digital currencies. You can read
Crypto Contest May 28: SaluS
SaluS (Bittrex: SLSUSD) has broken out of the triangle pattern in the weekly chart.
(Chart courtesy of Tradingview.com (log scale))
Elliott Wave Analysis
In Elliott Wave terms, SaluS began a wave one advance in January 2016. The red wave one (blue sub-waves i-ii-iii-iv-v) finished in December 2017, and the red wave two (blue sub-waves a-b-c) correction ended in March this year. If this wave count is correct, SaluS should be heading next towards the December 2017 peak in the red wave three.
(Chart courtesy of Tradingview.com (log scale))
Funnymentals
Main goal and objective for Salus project is to give it’s members that extra edge when it comes to trading
Crypto Contest May 27: Content Neutrality Network
Content Neutrality Network (Bitfinex: CNNUSD) has broken out of the triangle pattern in the daily chart.
(Chart courtesy of Tradingview.com (log scale))
Elliott Wave Analysis
In Elliott Wave terms, CNN began a wave one advance on February 6. The red wave one (blue sub-waves i-ii-iii-iv-v) finished on April 7, and the red wave two (blue sub-waves a-b-c) correction ended on May 14. If this wave count is correct, CNN should be heading next towards the April 7 peak in the red wave three.
(Chart courtesy of Tradingview.com (log scale))
Funnymentals
Content Neutrality Network is a blockchain-based content ecosystem. Crypto Tone interviewed the founder in February this year.
(Sources:
Forex Analysis Report – 5/26/19…I Missed My NZD/USD Short Opportunity
The New Zealand Dollar remains under pressure early Thursday as lingering U.S.-China trade tensions continue to weigh on sentiment. Sellers are also responding to heightened concerns about global growth and the news that the Trump administration is considering Huawei-like sanctions on Chinese video surveillance firm Hikvision.Bearish traders are also betting on a further reduction of the cash rate before year end. That could be the reason why the New Zealand Dollar failed to draw support from Wednesday’s better-than-expected retail sales data.The release of the Fed minutes on Wednesday failed to generate much movement in the currency. Even with the Fed
Crypto Contest May 26: Celer Network
Celer Network (Binance: CELRUSDT) has broken out of the triangle pattern in the four-hour chart.
(Chart courtesy of Tradingview.com (log scale))
Elliott Wave Analysis
In Elliott Wave terms, Celer Network began a wave one advance on May 9. The red wave one (blue sub-waves i-ii-iii-iv-v) finished on May 21, and the red wave two (blue sub-waves a-b-c) correction ended on May 25. If this wave count is correct, Celer Network should be heading next towards the May 21 peak in the red wave three.
(Chart courtesy of Tradingview.com (log scale))
Funnymentals
Celer Network is a layer-2 scaling platform that enables fast, easy and secure off-chain transactions. BlockchainBrad interviewed the
Psychological Stages of Investing in Real Estate
Like anything else in life the biggest obstacle to our progress is often ourselves. Most people progress through these psychological stages of real estate investing, but some get stuck.
This is something I have talked about in the past and thought worth revisiting.
Psychological Stages of Investing in Real Estate
1. Nervous Beginner
This is when you are yet to do your first deal or maybe you have even done a deal with a mentor and are on to doing one by yourself.
You have decided that investing in rental properties is the right investment for you. You are excited about it, you have done
Crypto Contest May 25: U Network
U Network (Huobi: UUUBTC) has broken out of the triangle pattern in the daily chart.
(Chart courtesy of Tradingview.com (log scale))
Elliott Wave Analysis
In Elliott Wave terms, U Network began a wave one advance on February 25. The red wave one (blue sub-waves i-ii-iii-iv-v) finished on April 8, and the red wave two (blue sub-waves a-b-c) correction ended on May 14. If this wave count is correct, U Network should be heading next towards the April 8 peak in the red wave three.
(Chart courtesy of Tradingview.com (log scale))
Funnymentals
U Network is a decentralized content asset storage, notarization, distribution, publishing and valuation network. Crypto Love reviewed the
Crypto Contest May 24: Bibox Token
Bibox Token (Huobi: BIXUSDT) has broken out of the triangle pattern in the daily chart.
(Chart courtesy of Tradingview.com (log scale))
Elliott Wave Analysis
In Elliott Wave terms, Bibox Token began a wave one advance on February 3. The red wave one (blue sub-waves i-ii-iii-iv-v) finished on April 3, and the red wave two (blue sub-waves a-b-c) correction ended on May 10. If this wave count is correct, Bibox Token should be heading next towards the April 3 peak in the red wave three.
(Chart courtesy of Tradingview.com (log scale))
Funnymentals
Bibox is an AI-enhanced encrypted digital asset exchange. SMC Capital interviewed the co-founder earlier this year.
(Sources: Bibox Token


