BITCOIN: Price projection using Bars Pattern. Just for Fun… :-)

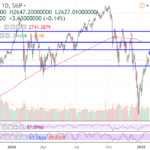
Using BITCOIN Weekly Chart, Log Scale.
Applying tool “Bars Pattern” of the previous BEAR/BULL Market, period from November 25th 2013 till December 18th 2017

Assuming End of Previous BEAR Market by end of August 2015
Fitting and adjusting “Peak to Peak” with the summit of the last Bull (December 18th 2017):

Conclusions:

Still a lower low would be expected. “Simulation” of the “Bars Pattern” indicates 2548 USD as the lowest point.
A “Consolidation” period of 7 to 8 months would be expected.
Start of A Bull Market September 2019
322.000 USD by the end of 2021
…in the meantime, lots of Dapps, crypto projects and adoption coming…

Will you have the patience to

BITCOIN – triangle and mini up channel still valid

Margin short picking up alittle. Test the mini channel bottom and quickly bounce again on 4hr chart. Consolidation still ongoing within up channel. Still possible to test big triangle bottom, 3450 gonna hold and bounce for it to stay valid.
News: (Current) | (Upcoming)
Short term moving average (day candle) :
RSI :
Network Value to Transactions Ratio :120
Total marketcap :119
Dominance :52.5
Bitfinex Margin Long/Short Volume Ratio :
Depth Chart : (S) | (R)
Weekly Timeframe :

The US Markets Path Going Forward $SPX $QQQ $IWM

The rally off the lows V shaped to new highs over the past 4 weeks. This was quite a V-shaped rally, which unsurprisingly, caught EVERYONE off guard. At the lows on Christmas Eve I said the rally is commencing and the immediate lows were in.
This was very important and still holds true. No one knows just how far the bounce goes, or rally for that matter but there are levels that should be noted. Regardless of how long it took, we are now here…

The market has 4 MAJOR levels of resistance that it will have to overtake before it

Is China A Buying Opportunity Or Value Trap???

On Monday, China announced that the Chinese economy grew 6.6 percent in 2018, which was the slowest pace since 1990. Also, Chinese President Xi Jinping said the country needed to be on guard for “black swan” events, while also preventing “grey rhino” events.

A black swan event is an unforeseen occurrence that has dire consequences whereas a grey rhino is an obvious threat that is ignored.

“The grey rhino is very clear, it’s the high level of debt in the whole economy from the government, the local government, and to the privately-owned enterprises 

On Tuesday, IMF Managing Director Christine Lagarde said the IMF cut

Crypto Contest January 25: TransferCoin

TransferCoin (Bittrex: TXBTC) has broken out of the triangle pattern in the weekly chart.

(Chart courtesy of Tradingview.com (log scale))
Elliott Wave Analysis
In Elliott Wave terms, TransferCoin began a wave one advance in September  2015. The red wave one (blue sub-waves i-ii-iii-iv-v) finished in October 2017, and the red wave two (blue sub-waves a-b-c) correction ended in November 2018. If this wave count is correct, TransferCoin should be heading next towards the October 2017 peak in the red wave three.

(Chart courtesy of Tradingview.com (log scale))
Funnymentals
TransferCoin is a cryptocurrency with masternodes. You can view the masternode stats below.

(Sources: TransferCoin and MasterNodes)

If you think this analysis

Qualcomm…Left Out Of The Rally

Xilinix, Teradyne, Lam Research and Texas Instruments all beat earnings expectations in their reports on Wednesday, sending the chip sector higher by the end of the day.  The only outlier was Qualcomm which was negative on the day.

Kerrisdale Capital, is shorting Qualcomm shares and released a research report stating that Qualcomm is “teetering on the brink of disaster” and that its unique business model is “living on borrowed time.”

The FTC sued Qualcomm for violated FRAND {fair, reasonable, and non-discriminatory} rules, which states that companies that become members of the rule structure must license their products to competitors.

Apple filed a lawsuit

Two Minute Crypto – Retail Crypto Investors Part Two

Please click the link to listen to this episode of the crypto podcast ‘Two Minute Crypto.’ These are intended to be short, single-topic ramblings on some aspect of the cryptosphere. Comments and critiques welcome. Please consider dropping a like and or a review on iTunes or Podbean if you enjoy the podcast.
 

Transcript:
 
Two Minute Crypto – Retail Crypto Investor’s Part Two
Last week I highlighted 4 of the harsh realities facing retail crypto investors and promised to balance the books the following week.
Reality check 5 – the books are not balanced.
No matter how you look at it – the average retail investor is

BTC 24 Jan – a change of direction

As I promised in my post of 22 Jan “Once I have better information I will publish an update in this regard (if necessary). “I have better information. You’re reading that update.

You can see my previous BTC post here: BTC 22 Jan – Medium-term updateIn it I proposed two possible scenarios: A drop to lower price levels or a modification to the tapering triangle we were in, resulting in a later price breakout.

In that post the price had just dropped through the bottom of the previous triangle, but not definitively so. For further details on those scenarios, see

STEEM – TD9 reversal valid

Last steem post mentioned about the possible TD9 reversal and indeed it happened. There’s should be some good support around 1030 with enough pullback from the highs. Possible bounce from there to complete possible HS with neckline 1030 and right shoulder high 1150-1190
stockpile for short : high (more slow bleed)
Short term moving average (day candle) :
RSI :
SBD/STEEM :
Weekly Timeframe :
24hr change :
Marketcap :113
Volume :1326
Current supply :
Total supply :
Debt Ratio :
Daily supply :
Total account :

BITCOIN – possible big symmetrical triangle

On 4hr chart, possible new symmetrical triangle on plot from daily candles so far consolidating within this triangle. Might still dip below 3500 but lowest 3450 should hold to make this triangle consolidation valid. Also possible mini double bottom W pattern forming. Let see if it can rally up to 3720 neckline level in 3-4 days time.
News: (Current) | (Upcoming)
Withdrawal of CBOE BTC ETF.
Short term moving average (day candle) :
RSI :
Network Value to Transactions Ratio : 120
Total marketcap : 119
Dominance : 52.4
Bitfinex Margin Long/Short Volume Ratio :
Depth Chart : (S) | (R)
Weekly Timeframe :