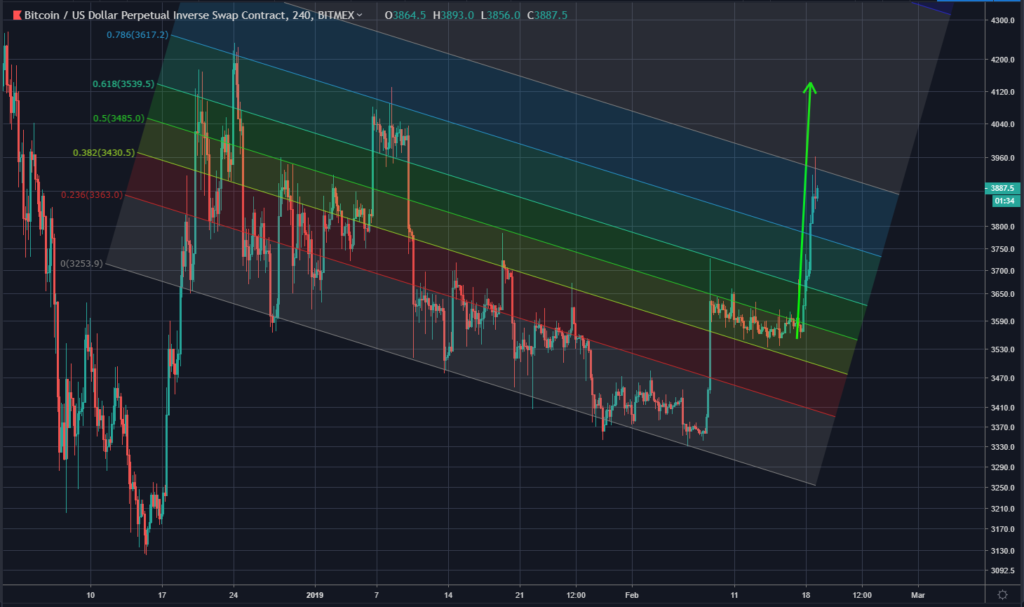
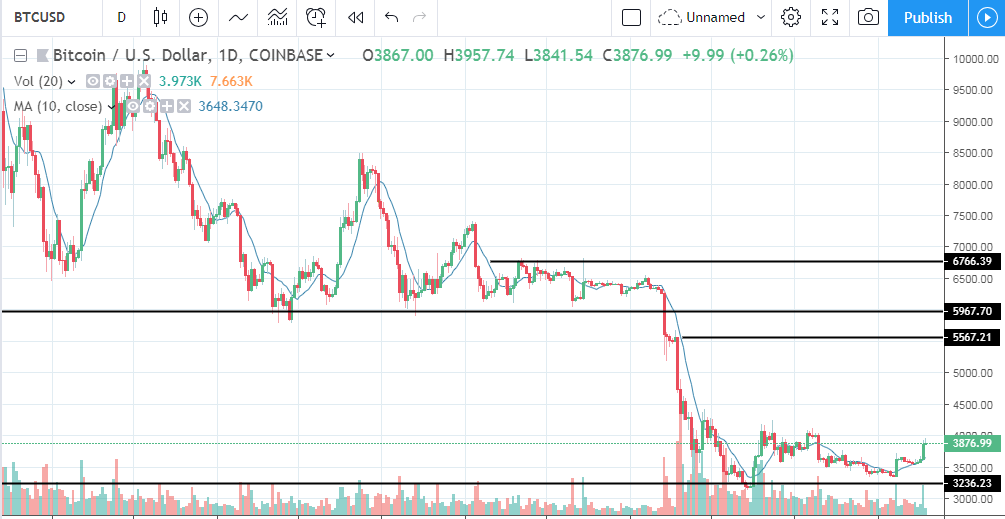
Bitcoin and EOS Analysis: CAN THE BULLS KEEP RUNNING?

Bitcoin broke above key resistance at $3,800. It’s now eyeing a very strong resistance zone between $4,000 and $4,120 (Coinbase). Daily volume remains strong at $9.9 Billion. This is the highest we’ve seen since May of 2018.

EOS easily took out the $3.00 resistance and is now eyeing $4.00. It started creating higher highs, all backed by the highest daily volume we’ve seen since June of last year.

In today’s video analysis I discuss where prices may be heading next, key areas to watch, traps to avoid and so much more. I hope you find it helpful.

Video Analysis:

If you don’t see the
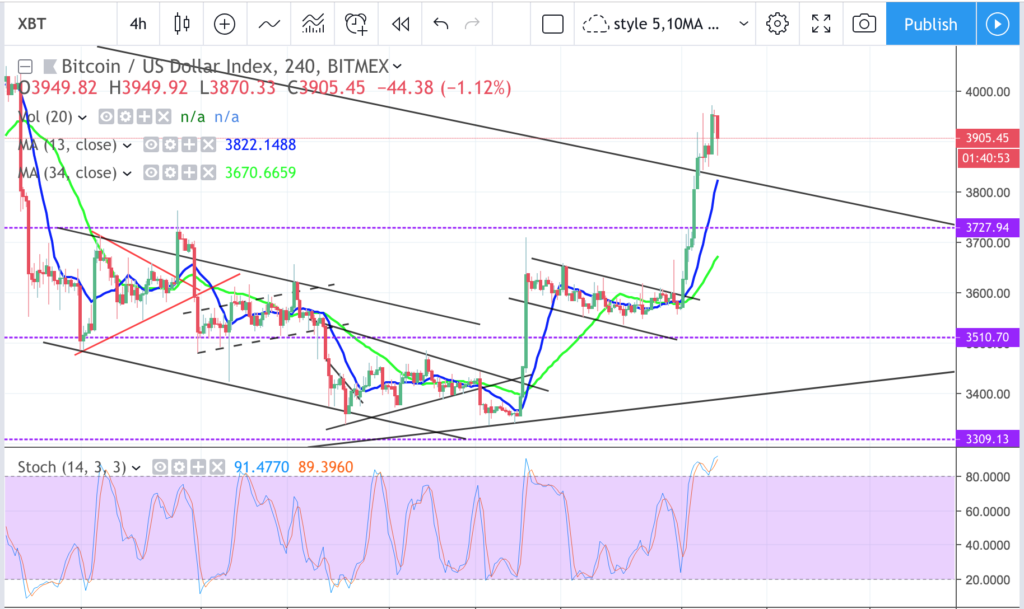
BITCOIN – 19 Feb

On 4hr chart,as mentioned strong sell wall around 4000 zone, doing some pullback to take a breather. Likely to consolidate along the big triangle top (possible 2nd leg staircase pattern completion if it start to consolidate narrow range). stoch extended.
News: (Current) | (Upcoming)
Short term moving average (day candle) :
RSI :
Network Value to Transactions Ratio :138
Total marketcap :133
Dominance :51.8
Bitfinex Margin Long/Short Volume Ratio :Both margin short and long decline. margin short below 20k
Depth Chart : (S) | (R)
Weekly Timeframe :

Two Minute Crypto – Learner’s Paradise

Please click the link to listen to this installment of my crypto podcast ‘Two Minute Crypto’. These are intended to be short, single-topic ramblings on some aspect of the cryptosphere. Comments and critiques welcome.

Transcript

Two Minute Crypto – Learner’s Paradise

Welcome to Two Minute Crypto – today I’d like to assert that crypto is a learner’s paradise but you need to bite deep of the apple to get the most out of it.

The cryptoverse – an appropriate title for all things crypto.

Of course, many people come to crypto for the money – the sniff of easy riches but I believe far more choose to

Forex Price Action Baby, No Technicals or Fundamentals…Trade #5 – Sold GBP/USD (2/19/19)

10,000 Ft View – 4 Hr Chart

Zooming In

I’m not in love with the set-up 100% because it’s in the middle of the range.

But what I love about the set-up was the strong move price made to the supply zone. In addition, price has moved over 150 pips. Potentially the buyers are exhausted and or taking profits and the sellers are stepping in with room for price to fall to the origin of the strong move.

This post is my personal opinion. I’m not a financial
advisor, this isn’t financial advise. Do your own research before making
investment decisions.

More Downside Risk For The Singapore Dollar

Singapore’s trade sector began 2019 on a whimper with non-oil domestic exports (Nodx) for January sliding a worse-than-expected 10.1%per cent from a year ago .

This was the biggest contraction in over two years since exports slumped 12 per cent in October 2016.  Analysts polled by Bloomberg were expecting a 3.5 per cent decline, given the high base effect of January 2018 when exports rose 13 per cent.

The drop in January 2019 was also the third straight month of decline after a 8.5 per cent year-on-year fall in December last year and 2.8 per cent decrease in November,  Enterprise Singapore figures released on Monday (Feb 18) show.

Source

Lets

Crypto Contest February 19: Factom

Factom (Poloniex: FCTUSD) has broken out of the triangle pattern in the daily chart.

(Chart courtesy of Tradingview.com (log scale))

Elliott Wave Analysis

In Elliott Wave terms, Factom began a wave one advance on August 13, 2018. The red wave one (blue sub-waves i-ii-iii-iv-v) finished on December 6, 2018, and the red wave two (blue sub-waves a-b-c) correction ended on January 28 this year. If this wave count is correct, Factom should be heading next towards the December 6, 2018 peak in the red wave three.

(Chart courtesy of Tradingview.com (log scale))

Zooming out in the monthly chart, I believe Factom is currently in the

BTC/Crypto Fib level-based analysis

With the rapid spike in crypto prices, it’s my job to attempt to predict the next move in the markets. I’m attempting that by means of Fib analysis.

Let’s start with my previous prediction:

On 10 Feb I wrote this post – also about BTC Fib levels (as you can probably tell from the title!): Bitcoin – Fib levels. In that post I predicted price drops to previous levels – on charts such as this one:

or even this one for capitulation events:

…but knowing crypto like I do: I included these clauses:

For the record: I estimate that BTC will do something similar to what is shown on

Bitcoin: More Price Changes, The More It Stays the Same

It is always nice to see an uptick in the crypto market.  Bitcoin had a nice day yesterday and is slightly higher today.  However, has price action changed at all?
More Price Changes, The More it Stays the Same
When you look at the bitcoin daily chart you see we are still firmly in the trading range of the last couple months.
Price needs to establish above 4,200 before we can see any true change in the current trading theme.
If that were to happen then we have upside all the way too 5,500 as evidence in the prior consolidation before the big drop

Unusual Options Activity In Uxin Limited

Uxin Limited, through its subsidiaries, operates an used car e-commerce platform in China. It operates Uxin Used Car, an application that provides consumers with customized car recommendation, financing, title transfer, delivery, insurance referral, warranty and other related services; and Uxin Auction, an application that helps business buyers to source vehicles through online auctions. The company facilitates used car transaction services and financing solutions offered by third-party financing partners to buyers for their used car purchases.

Source

Uxin has been in a steady decline ever since December as news coming out of China pointed to their economy decelerating.  The decline continued in to