CSX Transportation…Not Full Steam Ahead

CSX reported near double-digit top-line growth for their fourth quarter after the closing bell on Wednesday.   CSX’s volume and pricing strength led to mid- to high-single-digit revenue growth in a number of freight categories, including chemicals, automotive, forest products and coal.   However,  CSX told investors to expect low-single-digit revenue growth in 2019, a 7% decrease from 2018.

CSX is in an “unfamiliar position,” as Wednesday’s earnings report did not consist of its typical big beat and management’s tone during the conference was void of any “swagger,” Shanker said in a Thursday note.

CSX said it can’t identify any trend in its business

Crypto Contest January 18: Power Ledger

Power Ledger (Binance: POWRBTC) has broken out of the triangle pattern in the weekly chart.

(Chart courtesy of Tradingview.com (log scale))
Elliott Wave Analysis
In Elliott Wave terms, Power Ledger began a wave one advance in November 2017. The red wave one (blue sub-waves i-ii-iii-iv-v) finished in January 2018, and the red wave two (blue sub-waves a-b-c) correction ended in November 2018. If this wave count is correct, Power Ledger should be heading next towards the January 2018 peak in the red wave three.

(Chart courtesy of Tradingview.com (log scale))
Funnymentals
Power Ledger provides blockchain energy solutions for humanity. You can view their peer-to-peer electricity trading project in Bangkok,

Sherwin-Williams and Lowes, For Better Or Worse

Shares of Sherwin-Williams tanked on Tuesday after the company warned that its earnings in 2018 came well short of guidance, citing weak sales in North American stores. 

The paint maker on Tuesday reported its preliminary results for the fourth quarter and full year 2018. Net income for 2018 is now expected to be $11.15 a share, well below previous guidance of between $13.85 and $14 a share. Shares of the lost more than 6% in Tuesday’s session.

Analysts will often look at the Sherwin-Williams as a barometer for health of the consumer and housing market.

Sherwin-Williams will continue to operate its own

STEEM – Stuck in a Trading Range

The price of steem saw a little pump the past couple days.   This has caught people’s attention and has folks speculating on why it has happened.
Here’s the thing, even with this little pump nothing has changed at the moment.  We are still in the same trading range we have been in, just now we are near the top end of it.
I know, I sound like a debbie downer.  I swear I’m just conveying what the charts are telling me though.  I do hope we can break this range to the upside.
Steem and the Range

As you can see looking at the

BITCOIN: Triangular formation…

Remember my post yesterday and my main Two Possibilities … Should I reconsider those scenarios ? Well, you have always to review and control the Plan, however, I have to say that both possibilities are still valid but one is taking more chances to be correct…

Today, BITCOIN has been drawing a nice Triangular Pattern, One spike up (b), another one down, repeating the same level…(a), (c).

Currently another green candle seems defining the (d)…

Breakage of the triangle usually happens on (e) but it can also happen on (d) as well so, we have to pay attention to the action of Bitcoin

Where Are We in the US Market Cycle?

The US Market endured one of the worst holiday seasons of all time this past Q4. Since then we have rallied HEAVILY off the lows and in fact, “one of the best starts in stock market history by the Russell 2000” has happened.
Well you remember what happened in 2016, with the worst start to the year? It may be about to turn into the exact opposite.

Above you will see where I believe we are in the cycle. After rising so STEEPLY, and possibly topping, you get the initial down move. Then you get “THE BOUNCE”. We are coming up on

Russell 2000…Look For It To Start Turning Down

They say the Russell 2000 leads the way down and leads the way up. 

The Russell 2000 lead the way down last quarter dropping almost 30% from its Aug 31 high vs the S&P 500 dropping almost 15% over the same period.

What a difference a new quarter and year make. The Russell 2000 has led the broader market, rising nearly 8% vs the S&P 500’s nearly 5% rise.  However, the Russell 2000 leading the broader markets might be short lived. 

Usually towards the end of the business cycle, rising interest rates hurt smaller companies the most because they have a higher debt

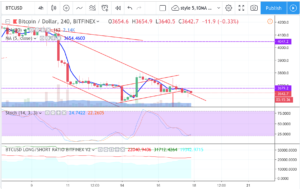
BITCOIN – lower low zone consolidation

Still on sideway move since 1 week ago, seem like it’s low from 3680 tiny candles consolidation to now around 3650 zone. Already past triangle apex point but neither side is giving way. Lower highs on 4hr chart, on hourly chart, lower highs and lower lows mini down channel.
News: (Current) | (Upcoming)
Short term moving average (day candle) :
RSI :
Network Value to Transactions Ratio :123
Total marketcap :121
Dominance :52.4
Bitfinex Margin Long/Short Volume Ratio :
Depth Chart : (S) | (R)
Weekly Timeframe :

Crypto Contest January 17: Augur

Augur (Bittrex: REPUSD) has broken out of the triangle pattern in the weekly chart.

(Chart courtesy of Tradingview.com (log scale))
Elliott Wave Analysis
In Elliott Wave terms, Augur began a wave one advance in December 2016. The red wave one (blue sub-waves i-ii-iii-iv-v) finished in January 2018, and the red wave two (blue sub-waves a-b-c) correction ended in December 2018.  If this wave count is correct, Augur should be heading next towards the January 2018 peak in the red wave three.

(Chart courtesy of Tradingview.com (log scale))
Funnymentals
Augur is a decentralized oracle and peer to peer protocol for prediction markets. Veil, a peer-to-peer trading platform built on Augur,

Has GE Bottomed??? – Part 2

Three weeks ago, I wrote about GE because I was starting to see articles questioning whether GE had bottomed.

But before considering going long, the conviction for me would be if price can pull back to the daily demand at $6.75, then take out the $8 level, the bottom in GE would be more convincing at that point.

Has GE Bottomed???

GE not only came back to retest the daily demand at $6.75, but closed above the $8 level.

Now the same analyst who upgraded the stock, when it was in the $6 range citing a more citing a more “balanced risk-reward” profile and