Bitcoin, EOS, Ethereum and Ripple Analysis: BREAKOUT

Bitcoin has been consolidating within a falling wedge these past couple weeks. Today it broke out of that wedge with a nice increase in volume behind it. Volume is no where near where it needs to be for a sustainable bull run, but that’s not to say it can’t get there.

EOS broke above the known $2.45 resistance. The next major area of resistance is $3.00. If it can remain above at least $2.70 today, it could be a sign this bullish move has legs.

Ethereum bounced nicely off the known $100 phycological support. It’s currently trading around $118. The next major


4th of July fireworks?

I swear that date is coincidental – though I’ll be that first to admit that it is conveniently useful!

From https://pixabay.com/en/new-year-s-eve-fireworks-beacon-1953253/ ; by nickgesell

First things first

I’m laying my bull flag theory to rest. It was nice while it lasted, but that “flag” has now become far too long, too tapered and too low down relative to the “flagpole” which preceded it. Ergo – it isn’t a bull flag. This means that the post “BTC 29 Jan – still on track” is now invalid.

BTC may have been on track, but now it’s derailed. It is still in the same channel (previously called

Bitcoin, EOS, ETH and Ripple Analysis: QUICK UPDATE

Bitcoin has broken below the $3,400 support, currently trading around $3,365 on Coinbase. Volume remains weak.

EOS seems unable to break above the $2.45 resistance, currently trading at $2.36 on Bitfinex.

Ethereum continues to bounce right above the psychological support of $100 on Coinbase.

Ripple is still operating within a falling wedge, currently trading around $0.29 on Bitfinex.

In today’s video analysis I discuss, where prices may be heading next, various trade setups I’m waiting on and so much more. I hope you find it helpful.
Video Analysis:


If you don’t see the above video, navigate to TIMM (https://mentormarket.io/workin/) or Steemit in order to watch.

I hope

Bitcoin Technical Analysis: CONSOLIDATING BEFORE NEXT MOVE

Bitcoin continues consolidating right on top of the 0.786 fib level. It’s been testing the top of what appears to be a falling wedge, but has yet to break out above. Volume remains weak.

In today’s video analysis I discuss, where price may be heading next, a possible trade setup I’m preparing for, traps to avoid and so much more. I hope you find it helpful.
Video Analysis:


If you don’t see the above video, navigate to TIMM (https://mentormarket.io/workin/) or Steemit in order to watch.

I hope this has been helpful. I’d be happy to answer any questions in the comment section below. Until

Word on the street is…

The price of BTC is driven by market sentiment.

That’s not the word on the street, that’s just a reminder of the basics of how markets work.

Word on the street is that BTC will move sideways during 2019.

From https://pxhere.com/en/photo/1396126 , shared under CC0

How do I know this?

Metadata. For those who may be unsure of exactly what “metadata” means:

“Data that describes other data, serving as an informative label.”~ https://en.wiktionary.org/wiki/metadata

You could think of me as a human data filter. Every day I siphon new crypto knowledge in, I process it, and then I spit out the results.

I’ve been siphoning up rather a lot

Bitcoin Technical Analysis: BULLS STRUGGLE… IS A LARGER MOVE COMING?

Bitcoin continues to bounce on top of the $3,400 support (on Coinbase). Volume has been declining over the past 48 hours.

Zooming out on the weekly chart, we get much better perspective on just how bearish this overall trend has been. Price broke below the $3,600 support. When it tried to break back above, $3,600 began to act as a strong resistance. The weekly chart suggests price may retest the prior low of $3,130 (on Coinbase). I’m not saying it will, but it’s a very real possibility. I discuss this much more, as well as the bullish scenario, in my video

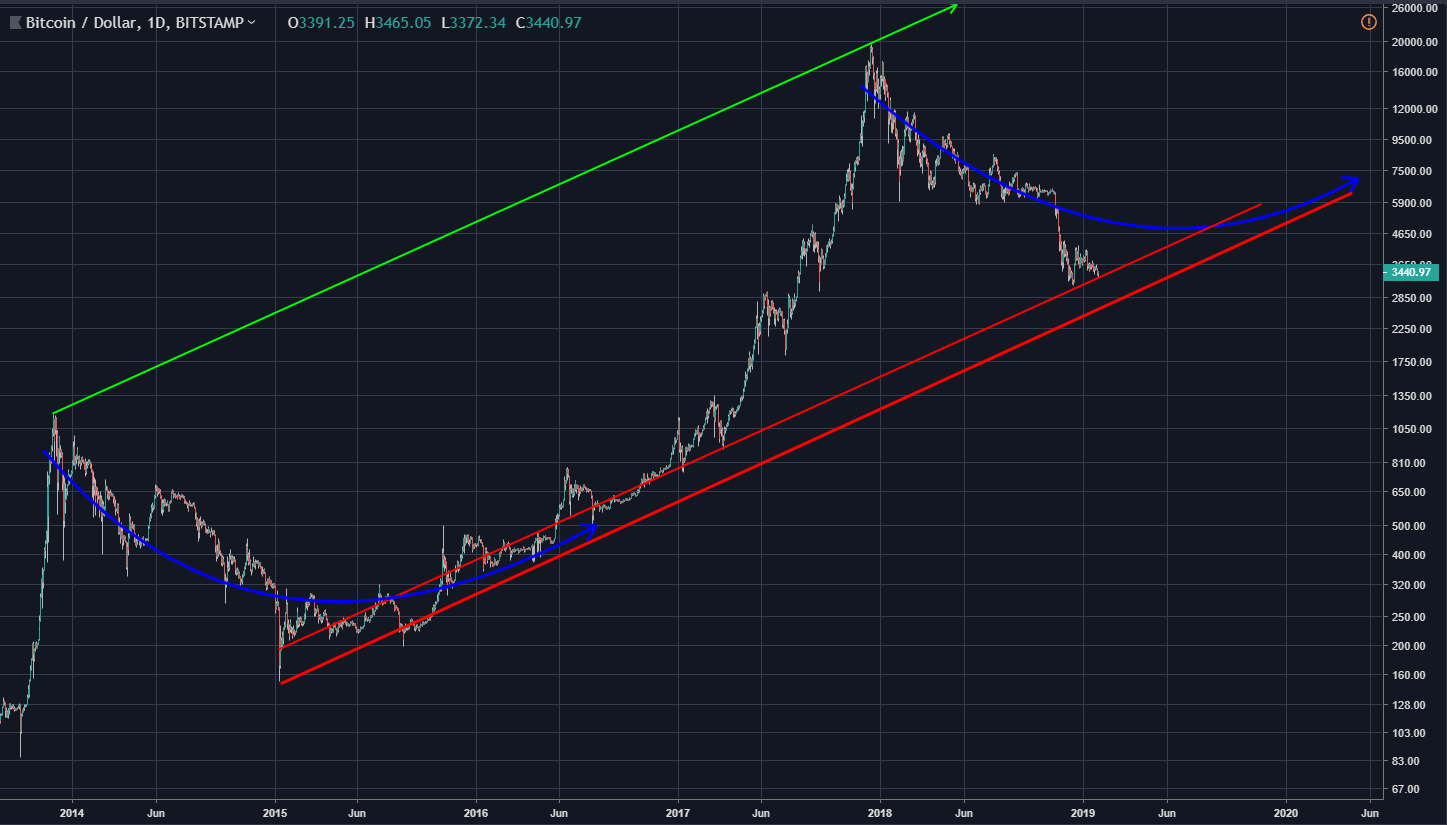
Bitcoin Long-term (31 Jan)

I’ve been promising an update to the long-term BTC chart since my BTC post of 10 January. Here it is.

The last time that I did a proper long-term look at BTC was when I looked tried matching the Fib levels of the 2014 bear market with those of the 2018 bear market, about 2.5 months ago.

For what it’s worth i think that I did a fairly decent job in that post, concluding that:

– $6069 may be a realistic post-capitulation consolidation level .– $3230 is a possible bottom for the 2018 bear market.– $3206 is also a possible bottom for

Technical Analysis for Bitcoin, EOS, ETH and XRP: BRIEF OVERVIEW

Bitcoin has broken back below $3,400 (Coinbase).

EOS is hovering around $2.27 (Bitfinex) and seems to be eyeing the $2.11 support.

Ethereum is sitting on the $100 phycological support. If that support breaks decisively, we could see it fall as low as $80.

Ripple (XRP) looks to be operating within a descending wedge. While this is a bullish pattern, it may get worse before it gets better.

In today’s video analysis I discuss, traps to avoid, where prices may be heading next and so much more. I hope you find it helpful.
Video Analysis:

 
If you don’t see the above video, navigate to TIMM (https://mentormarket.io/workin/) or

Bitcoin ventriloquism

Oh how Jamie Dimon makes me smile! It seems that he is now attempting to play the role of “Puppet Master”, in a rather obvious fashion.

For a man who states:

“I could care less about Bitcoin”~ https://www.youtube.com/watch?v=40OuVyVGdIM

it seems strange that he just can’t shut up about it.

Today I’ve been inspired by the article “Bitcoin Could Fall Below $1,260 if the Bear Market Continues: JP Morgan Analysts”, which sounds like typical anti-Bitcoin propaganda fresh from the mouth of Dimon himself; only it isn’t.

Instead he has his minions saying his words for him – his puppet employees at JP Morgan.

Let’s look at some of the Dimon-like quotes from the article and I’ll

Technical Analysis for Bitcoin: Quick Update

Bitcoin finally broke down below the $3,500 support it’s been hovering on for the last 2 weeks. It dropped to the known $3,400 support and is currently trading around $3,430.

Looking at the daily chart we can see bitcoin bounced right off the bottom Bollinger band.

In today’s video analysis I discuss, where price maybe heading next, traps to avoid and so much more. I hope you find it helpful.
Video Analysis:


If you don’t see the above video, navigate to TIMM (https://mentormarket.io/workin/) or Steemit in order to watch.

I hope this has been helpful. I’d be happy to answer any questions in the comment