Turns Out I was Right…Jamie Dimon and his Weasel Move

It wasn’t that long ago that you saw this…“Jamie Dimon Slams Bitcoin as a Fraud”

As soon as this hit the news wire I had a feeling that Dimon was attempting to pull one of his weasel banker moves that banks pull daily througout the financial markets. See this is how it works. Banks funnel news in order to set up the actual move of the direction of the asset (which they know many times based on the inside sources and collaboration with other banks). In this case here is how it played…

Bitcoin had left the station “at the time” and
Crypto Contest February 14: Stealth

Stealth (Bittrex: XSTUSD) has broken out of the triangle pattern in the weekly chart.

(Chart courtesy of Tradingview.com (log scale))

Elliott Wave Analysis

In Elliott Wave terms, Stealth began a wave one advance in November 2015. The red wave one finished in October 2016, and the red wave two correction ended in January 2017. The red wave three (blue sub-waves i-ii-iii-iv-v) advance finished in January 2018, and the red wave four (blue sub-waves a-b-c) correction ended in November 2018. If this wave count is correct, Stealth should be heading next towards the January 2018 peak in the red wave five.

(Chart courtesy of Tradingview.com

Crypto Contest February 14: Stealth

Stealth (Bittrex: XSTUSD) has broken out of the triangle pattern in the weekly chart.

(Chart courtesy of Tradingview.com (log scale))

Elliott Wave Analysis

In Elliott Wave terms, Stealth began a wave one advance in November 2015. The red wave one finished in October 2016, and the red wave two correction ended in January 2017. The red wave three (blue sub-waves i-ii-iii-iv-v) advance finished in January 2018, and the red wave four (blue sub-waves a-b-c) correction ended in November 2018. If this wave count is correct, Stealth should be heading next towards the January 2018 peak in the red wave five.

(Chart courtesy of Tradingview.com

Crypto Contest February 14: Stealth

Stealth (Bittrex: XSTUSD) has broken out of the triangle pattern in the weekly chart.

(Chart courtesy of Tradingview.com (log scale))

Elliott Wave Analysis

In Elliott Wave terms, Stealth began a wave one advance in November 2015. The red wave one finished in October 2016, and the red wave two correction ended in January 2017. The red wave three (blue sub-waves i-ii-iii-iv-v) advance finished in January 2018, and the red wave four (blue sub-waves a-b-c) correction ended in November 2018. If this wave count is correct, Stealth should be heading next towards the January 2018 peak in the red wave five.

(Chart courtesy of Tradingview.com

So You Bought Bitcoin at the All-Time High…

Please click the link to listen to the 26th episode of my weekly crypto podcast ‘Two Minute Crypto.’ These are intended to be short, single-topic ramblings on some aspect of the cryptosphere. Comments and critiques welcome.

https://itunes.apple.com/au/podcast/two-minute-crypto-so-you-bought-btc-at-the-all-time-high/id1441492450?i=1000429769938&mt=2orhttps://www.podbean.com/media/share/pb-pa3xy-a7b50e

Transcript

Two Minute Crypto

Welcome to Two Minute Crypto. Today’s episode focuses on the predicament of those investors who bought Bitcoin at or near all-time highs. So, you bought Bitcoin in or around its all-time high. Let’s be honest you more than likely hopped on the crypto train expecting short sharp returns and now you find yourself looking at very heavy losses. It’s been a grim year for that

BITCOIN: either a “Bull” Flag or “BART” Flag

A few days have gone since I have posted about BITCOIN and , to tell you the truth, I felt like it did not deserve to do so till now.

Market is in “consolidation” mode, trying to decide which way to take now and the volume has kept constant since almost 5 days ago, stuck around 6.5 b$ which is not bad since it was 5b$ just a week ago…

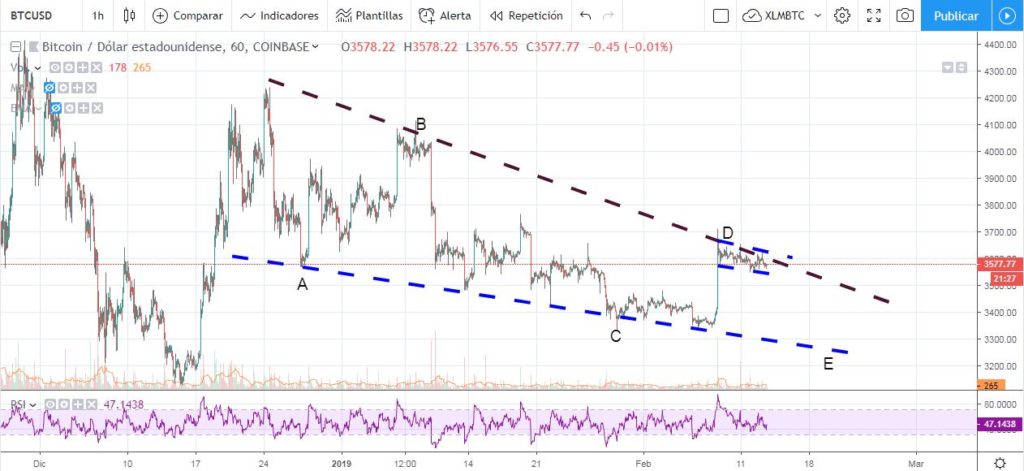
As expected, BITCOIN has been dancing and still is doing so just below the upper line of the falling wedge.

It is true that 5 days ago I expected a continuation of the

Bitcoin and EOS Technical Analysis: BREAKOUT LOOMING?

Bitcoin continues to consolidate, but is showing numerous signs of a possible breakout. I discuss this further in my video analysis at the bottom.

EOS has been trying to break above the $3.00 resistance. While it’s briefly penetrated by a wick, a decisive break above has been unsuccessful. Volume has been slowly rising and, like bitcoin, we are seeing signs of a possible breakout in the near future.

In today’s video analysis I discuss where prices may be heading, traps to avoid and so much more. I hope you find it helpful.

Video Analysis:

If you don’t see the above video, navigate to TIMM

BITCOIN – 13 Feb

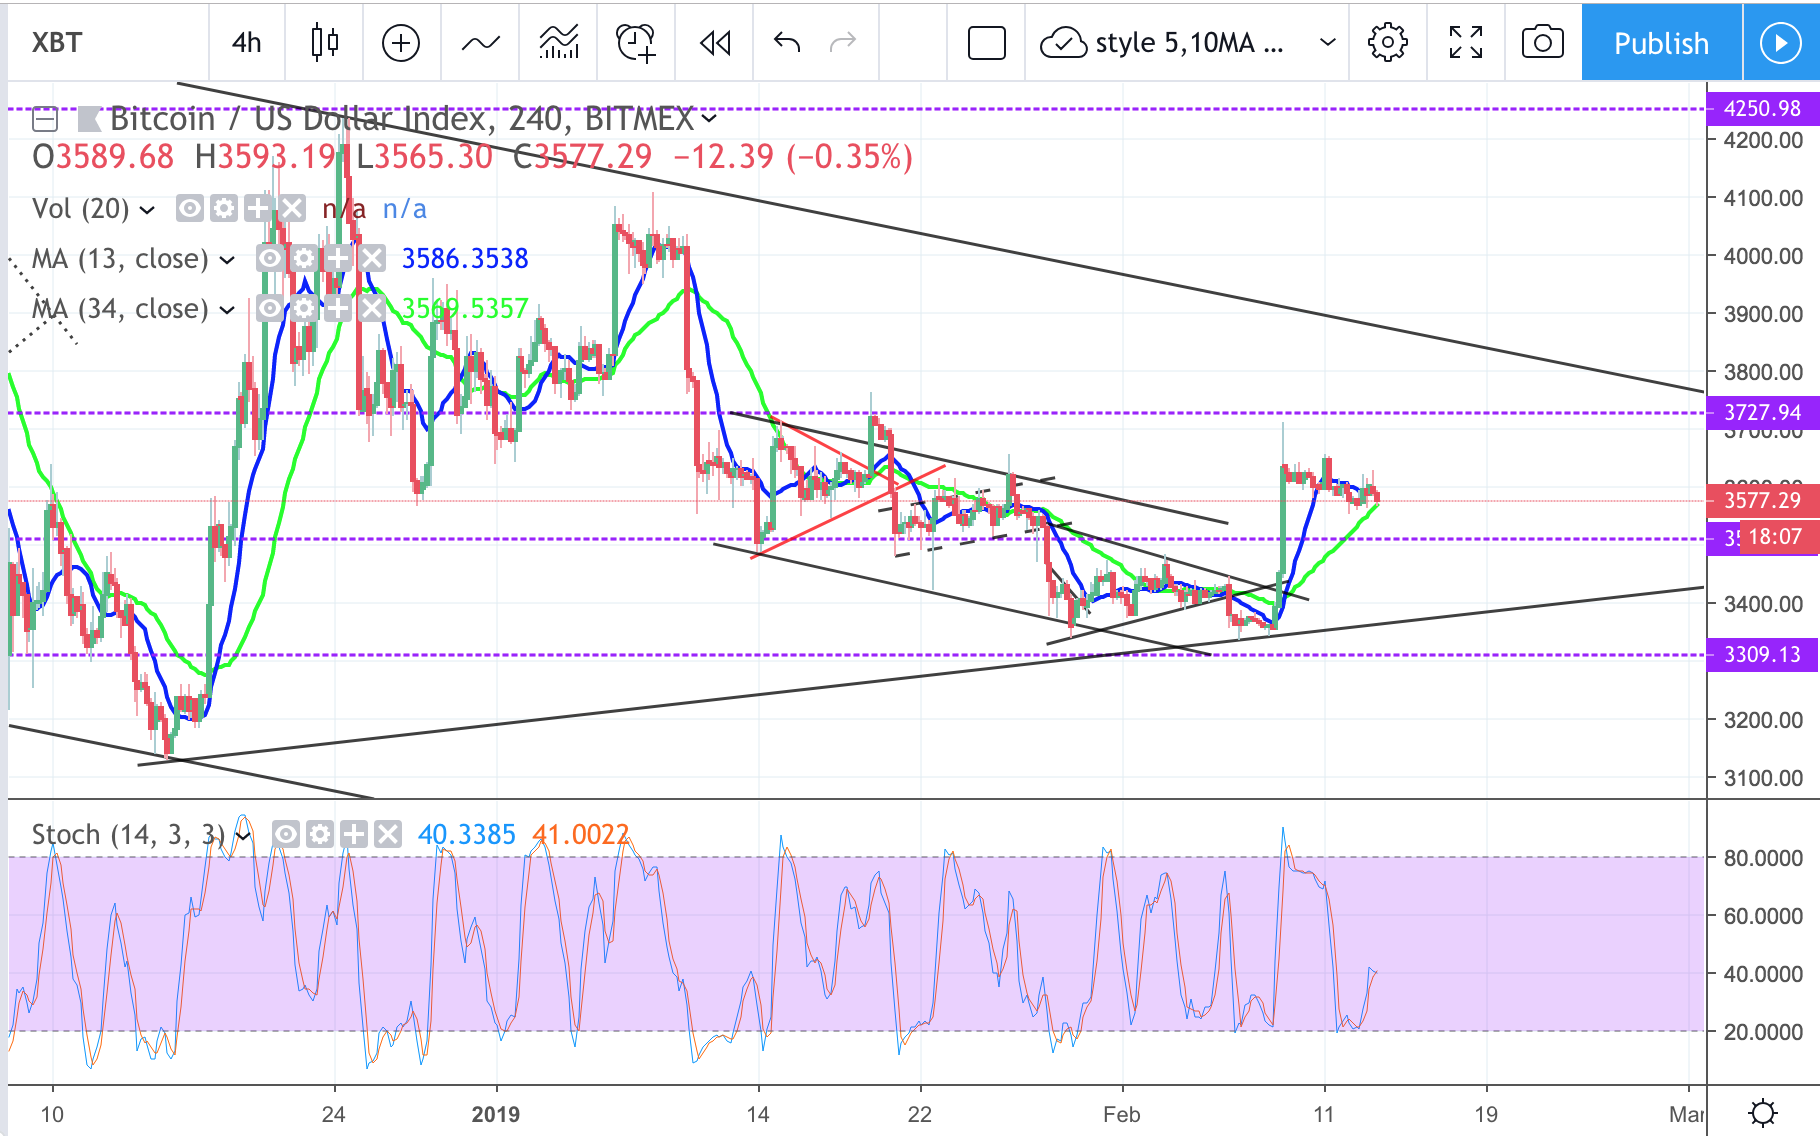
On 4hr chart, about time for consolidation to breakout. Which direction it gonna head ? Possible 2nd leg up staircase pattern to test 3700 zone then consolidate again till near big triangle/channel top resistance for next move. On daily looks like there support strength around 3530 which it may test before that then bounce. Possible for downside selloff to triangle bottom but not likely yet.
News: (Current) | (Upcoming)
Short term moving average (day candle) :
RSI :
Network Value to Transactions Ratio :124
Total marketcap :120
Dominance :52.7
Bitfinex Margin Long/Short Volume Ratio :
Depth Chart : (S) | (R)
Weekly Timeframe :
HOT ~ !!
►FREE to Play and

Crypto Contest February 13: Odyssey

Odyssey (Bittrex: OCNBTC) has broken out of the triangle pattern in the daily chart.

(Chart courtesy of Tradingview.com (log scale))

Elliott Wave Analysis

In Elliott Wave terms, Odyssey began a wave one advance on August 14, 2018. The red wave one (blue sub-waves i-ii-iii-iv-v) finished on October 17, 2018, and the red wave two (blue sub-waves a-b-c) correction ended on February 10 this year. If this wave count is correct, Odyssey should be heading next towards the October 17, 2018 peak in the red wave three.

(Chart courtesy of Tradingview.com (log scale))

Funnymentals

Odyssey’s mission is to build the next-generation decentralized sharing ecomony & peer-to-peer ecosystem. Odyssey

Crypto Analysis Report 2-12-19…Litecoin Is At Another Critical Level

The last time I spoke about Litecoin, price was at a do or die price level,

Crypto Analysis Report 1-20-19…Litecoin Is At A Critical Level

The level to pay close attention to on Litecoin is the $30 level. Not only is this a psychological round number, but price is attracted to this level going back all the way to May 2017.

So if price breaks below $30, the pivot low at $22 must hold. If price breaks above $30, the next test will be the daily supply at $44.

Not only did price hold the $30 level, but breached the $44