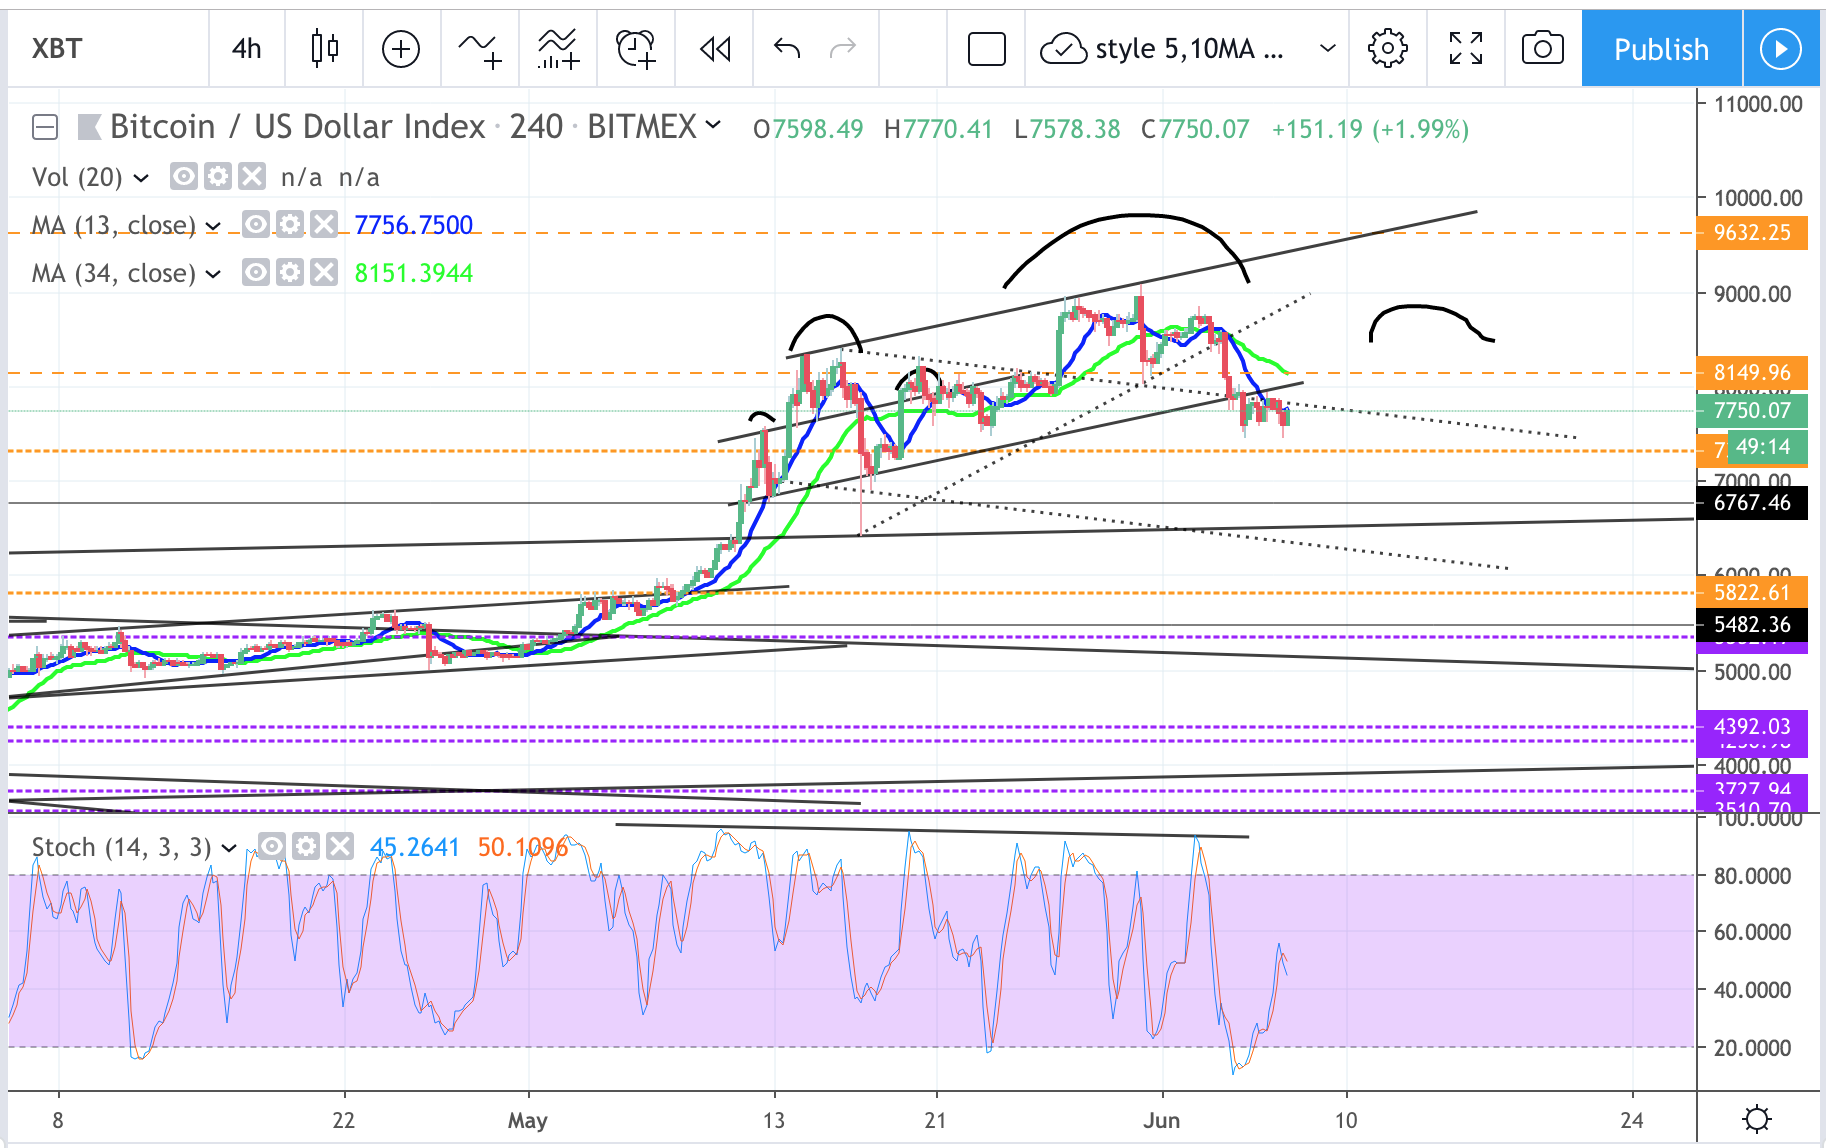
On 4hr chart, despite the bounce still maintain the opinion of limited upside and more toward downside to test the 6800 or even 6500 zone for the possible HS.
News: (Current) | (Upcoming)
Short term moving average (day candle) :
RSI :
Network Value to Transactions Ratio :115
Total marketcap :254
Dominance :55.4
Bitfinex Margin Long/Short Volume Ratio :
Depth Chart : (S) | (R)
Weekly Timeframe :
Tag: Cryptocurrencies
Investing Principles I Regularly Remind Myself Of
Principles are the foundation of our decision making. Having solid principles when it comes to investing is rather integral to success.
A few good Investing Principles
You have to be aggressive and defensive in investing
So what exactly does this mean? Basically, when the opportunity arises you must take big swings to make real money, but at the same time you need to make sure that if that swing misses it isn’t so big it knocks you out of the game.
You can never be more than 20% diversified within the same asset class
Easiest example – cryptocurrency. If you are only invested in crypto
ENG technical analysis
ENG seen from the temporality of 1D we can observe as in the last touch in the parabola, the structure of sails entered in an inverted ascending wedge in which it has respected very well the support of the wedge provoking the recent push of 4 sails alcistas, the current sail is touching a triple resistance, this becomes a strong signal that we will have a correction, another important point to keep in mind in this image is to see how the price has claimed the support of the 6586, we should see that the price makes us a pullback
BITCOIN: Two important levels to watch out
Despite the correction seems to be done, I am not satisfied at all on regards what we can see on the 4hour-chart of BTC/USD.Certainly, BTC bottomed around 7400 USD while I was expecting 7300 USD as a good entry point (see my post of 3 days ago) but the trading volume does not differ so much from the last days and even if we are upwards, this variable seems to be stagnant nowadays… You can see how different it was when we were seeing BTC growing on early May…
However, the Volume is one of the factors to take into account
Bitcoin, EOS, LTC, ETH, BNB and XRP Analysis: Bulls Put Up a Fight
Yesterday we discussed how bitcoin would likely retest the $7,500 support. I had my doubts this support would hold a second time, but bulls proved again they’re not out of the fight. We watched a textbook double bottom bounce as price rallied to about $8,000 before finding resistance. It’s currently trading around $7,950 on Coinbase. Daily volume is stagnant, suggesting traders are still taking a watch and wait approach.
In today’s video I analyze Bitcoin, EOS, ETH, LTC, BNB and XRP. We’ll discuss where prices might be heading next, key areas to watch, traps to avoid and so much more. I
A Stable of Binance Coins – General musings
By now I’m sure that most of you have heard that Binance will be launching it’s own stablecoins soon. They have been testing with a small amount of BGBP – a coin pegged to the British Pound (GBP) and they say that others are in the pipeline.
The Binance approach is an interesting one, because unlike most other stablecoins, they are not focussing on USD based coins. Indeed, they are specifically NOT focussing on USD.
Binance has clearly been studying the stablecoin environment for some time, you can see the results of this in their stablecoins research report published last month: “The
Crypto Contest June 7: Fetch
Fetch (Binance: FETBTC) has broken out of the triangle pattern in the four-hour chart.
(Chart courtesy of Tradingview.com (log scale))
Elliott Wave Analysis
In Elliott Wave terms, Fetch began a wave one advance on May 10. The red wave one (blue sub-waves i-ii-iii-iv-v) finished on May 21, and the red wave two (blue sub-waves a-b-c) correction ended on May 27. If this wave count is correct, Fetch should be heading next towards the May 21 peak in the red wave three.
(Chart courtesy of Tradingview.com (log scale))
Funnymentals
Fetch brings together machine learning, artificial intelligence, multi-agent systems and decentralized ledger technology to create an economic internet. You can watch
BITCOIN – 6 Jun
On 4hr chart, narrow consolidation and limited upside.Likely to close off the week bearish and more downside next week.Possible heading to test 6800 SR zone.
News: (Current) | (Upcoming)
Short term moving average (day candle) :
RSI :
Network Value to Transactions Ratio :122
Total marketcap :249
Dominance :55.3
Bitfinex Margin Long/Short Volume Ratio :
Depth Chart : (S) | (R)
Weekly Timeframe :
Two Minute Crypto – Riding the Bull Part 2 of 5
Please click the link to listen to the 40th episode of my weekly crypto podcast ‘Two Minute Crypto.’ These are intended to be short, single-topic ramblings on some aspect of the cryptosphere. Comments and critiques welcome.
External Podcast Links:
https://podcasts.apple.com/au/podcast/two-minute-crypto-riding-the-bull-part-2-of-5/id1441492450?i=1000440765816
or
https://www.podbean.com/eu/pb-d6fdn-b3ab50
Transcript
Two Minute Crypto – Riding the Bull Part 2 of 5
Welcome to Two Minute Crypto – the first episode in this series discussed information flow and the importance of assessing the quality of and the incentives behind your ‘go-to’ sources of information. This installment focuses on planning. Whether you are an active day trader, a long-term horizon investor or a bit of both,
MITH technical analysis
MITH seen from the temporality of 1D we can see how the current candle has found support in the 494 making a double floor, however, we can also see that the price when reaching the resistance of the 546 was rejected causing the current sales force, if the candle closes below the aforementioned support, it is very possible that we find a good entry in the support below the 401, with this would be forming a very bullish setup when claiming the support of the 494.
MITH seen from the temporality of 1W we can see how the previous bearish candle