Bitcoin Analysis: Consolidating Before Next Move

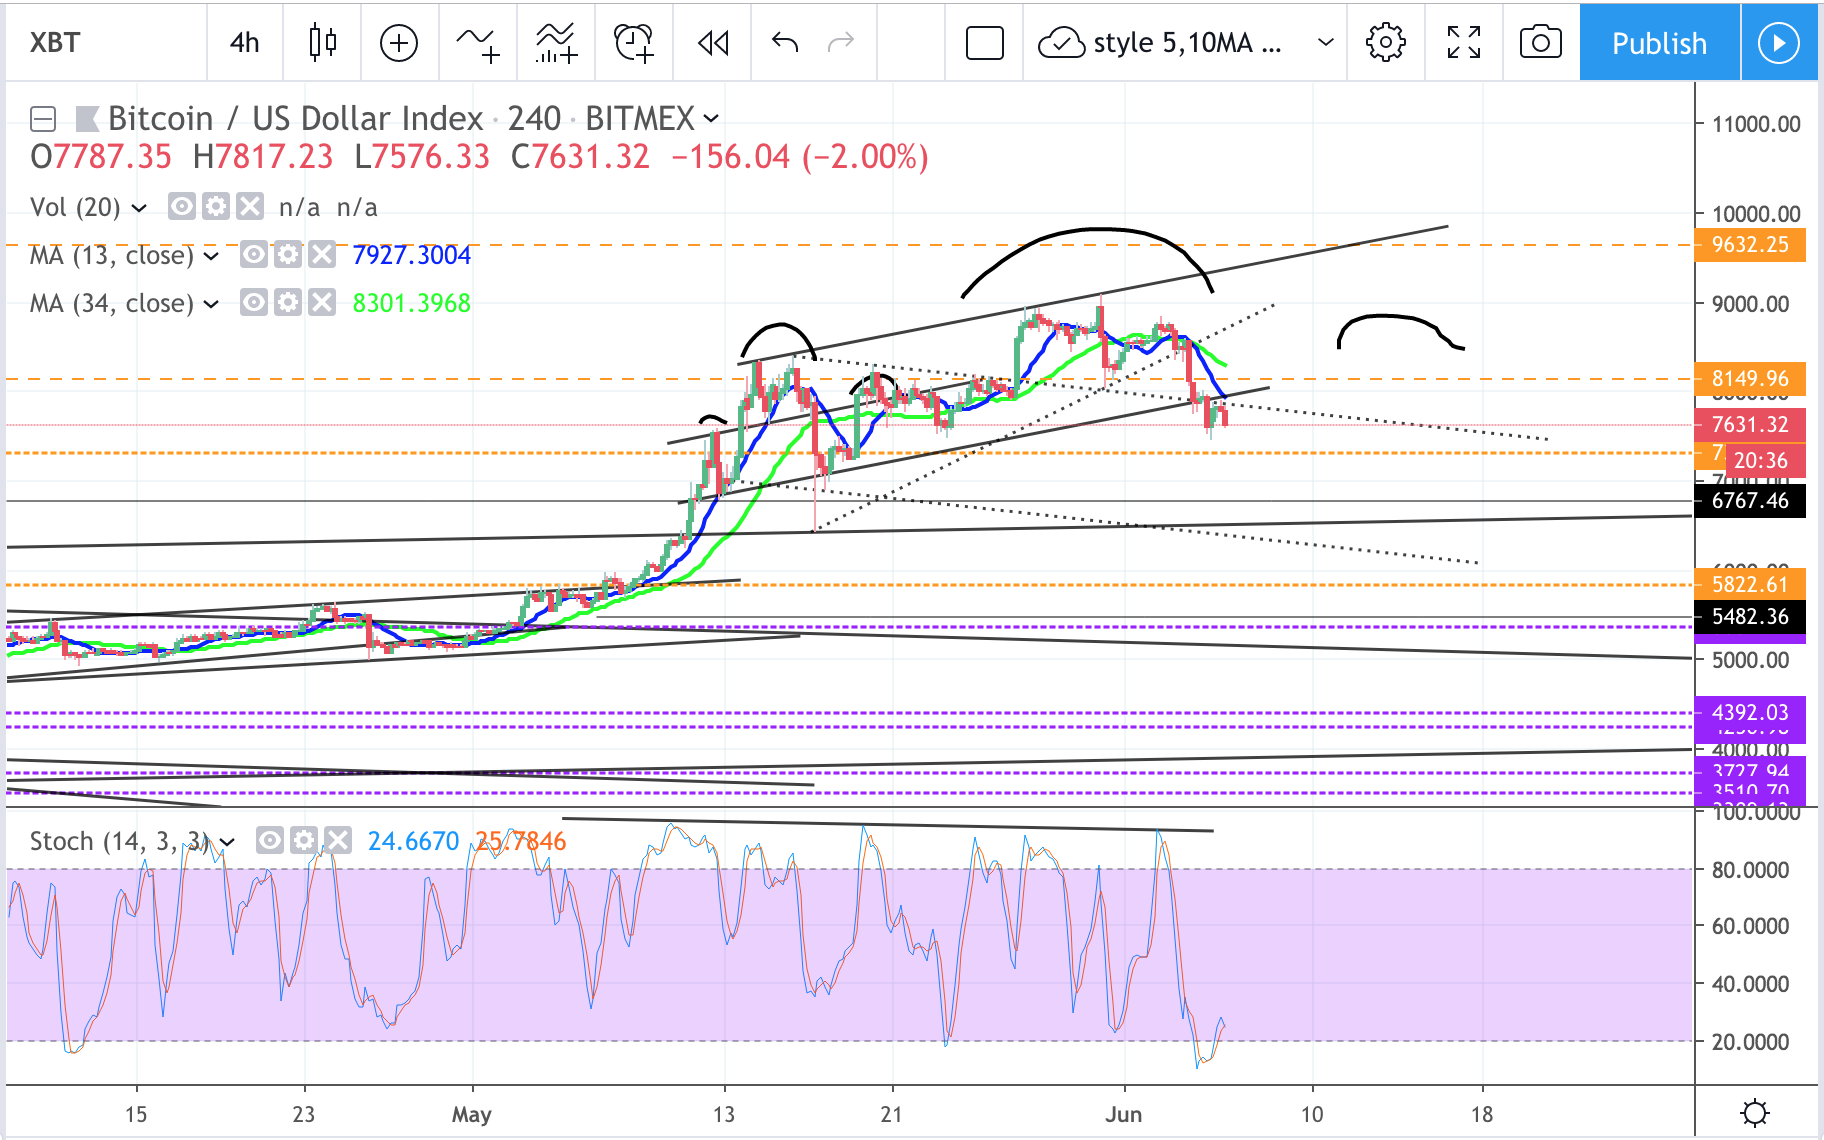
Bitcoin has been consolidating on top of major support at $7,500. It seems to be getting squeezed within a small wedge, currently trading around $7,700. Daily volume has died off a bit as traders are waiting for the next move.

We’ve now seen a daily candle open and close below the 21 day EMA.

Long and short positions are both dropping, suggesting a lack of confidence in direction.

In today’s video I discuss where price may be heading next, buy and sell targets, traps to avoid and so much more. I hope you find it helpful.

Video Analysis:

If you don’t see the above video,

Crypto Shopping Cart – 06 June

Prices went down, but the market is clearly moving along. That can only mean one thing: time to get the Shopping Cart into gear!

BTC has made some good gains this year, but for the most part, altcoin prices remain very low compared to BTC. The whole market may have climbed by about 150%, but the alts have been slow to gain any sat value. While we can’t be certain of this, it is likely that altcoins will eventually make significant gains against BTC. I believe in BTC, I really do, but I don’t believe that it should hold over 50%

Crypto Contest June 6: Grin

Grin (Poloniex: GRINBTC) has broken out of the triangle pattern in the daily chart.

(Chart courtesy of Tradingview.com (log scale))

Elliott Wave Analysis

In Elliott Wave terms, Grin began a wave one advance on May 14. The red wave one (blue sub-waves i-ii-iii-iv-v) finished on May 21, and the red wave two (blue sub-waves a-b-c) correction ended on June 3. If this wave count is correct, Grin should be heading next towards the May 21 peak in the red wave three.

(Chart courtesy of Tradingview.com (log scale))

Funnymentals

Grin is a cryptocurrency focused on privacy without censorship in its implementation of Mimblewimble. The Cryptoverse covered the coin earlier

OMG technical analysis

OMG seen from the temporality of 1D we can see the setup of a symmetrical triangle, the diagonal bull has formed two minima with bullish inclination, signal of a greater force on the part of the bulls to reverse the current trend, we could see that the candle touches a third time the diagonal or only that enters the area of demand indicated in the chart within a gray rectangle, that new point should push the price up to achieve the break of the figure and reach our first take profit located within the price range of 309 – 315,

BITCOIN – 5 Jun

On 4hr chart, it did came down to 7900 and went below. Likely for more downside to test 7300 zone S/R. Possible HS forming, may head towards neckline around 6500~6400 zone.
News: (Current) | (Upcoming)
Short term moving average (day candle) :
RSI :
Network Value to Transactions Ratio :122
Total marketcap :244
Dominance :55.8
Bitfinex Margin Long/Short Volume Ratio :
Depth Chart : (S) | (R)
Weekly Timeframe :

KYC? No thanks!

Every day, without fail, I see crypto supporters arguing in favour of KYC.

KYC does have a place in crypto, but not nearly to the extent that is commonly believed.

Before I get into this post, I have to make a slight detour on behalf of the Americans who may be reading this. Please bear with me:

For the Americans: (generalizations to follow)

I have noticed that Americans in particular are pro-KYC, far more so than other crypto investors. I believe that this is because Americans are largely isolated from the outside world. As a large country with great wealth, American citizens can happily live their entire

Crypto Contest June 5: Matic Network

Matic Network (Binance: MATICBTC) has broken out of the triangle pattern in the four-hour chart.

(Chart courtesy of Tradingview.com (log scale))

Elliott Wave Analysis

In Elliott Wave terms, Matic began a wave one advance on April 26. The red wave one finished on April 26, and the red wave two correction ended on May 10. The red wave three (blue sub-waves i-ii-iii-iv-v) advance finished on May 21, and the red wave four (blue sub-waves a-b-c) correction ended on June 3. If this wave count is correct, Matic should be heading next towards the May 21 peak in the red wave five.

(Chart courtesy of Tradingview.com (log scale))

Funnymentals

Matic

NEO technical analysis

NEO seen from the temporality of 1D we can observe how the price maintains an upward movement inside an ascending wedge, one would expect that the price will find rebound just in the support located in the 1477, as we see it marked in the graph of above with a horizontal red color, to continue with the upward setup, the price should follow the trajectory that I have drawn in the image, this is a classic movement of 7 touches inside the setup, the minima to maintain a position each time higher in inclination (signal that new bulls are incorporated

BITCOIN: Expected correction on-going

Still trying to understand what is causing the drop on the market these days?

I quit already from searching the reasons long time ago, I am only stick to the Psychological aspect of the market…news supporting the different scenarios often comes later on…

For “common mortals” as we are, it is really difficult to anticipate your next move based only in news and rumors, actually what usually happens is that rumors and news come in a weirdly and sudden manner and they are only reachable in a first chance for only a few…

Normally, when you read about a rumor, the rise or

Bitcoin, EOS, ETH, LTC, BNB, BAT and XRP Analysis: Bulls Trying to Hang On

In my last couple updates, I discussed the real possibility bitcoin was topping out. It’s now decisively broken below the $8,150 support. The next area of support is $7,550.

Price is currently below the 21 Day EMA. If a daily candle opens and closes below the 21 day EMA, I’d likely signal more downside to come and possibly the start of a larger correction.

In today’s video I analyze Bitcoin, EOS, BNB, BAT, LTC, ETH and XRP. We’ll discuss where prices may be heading next, key areas to watch, possible buy/sell targets and so much more. I hope you find it helpful.

Video