BTC Prints Green 4 Months in a Row

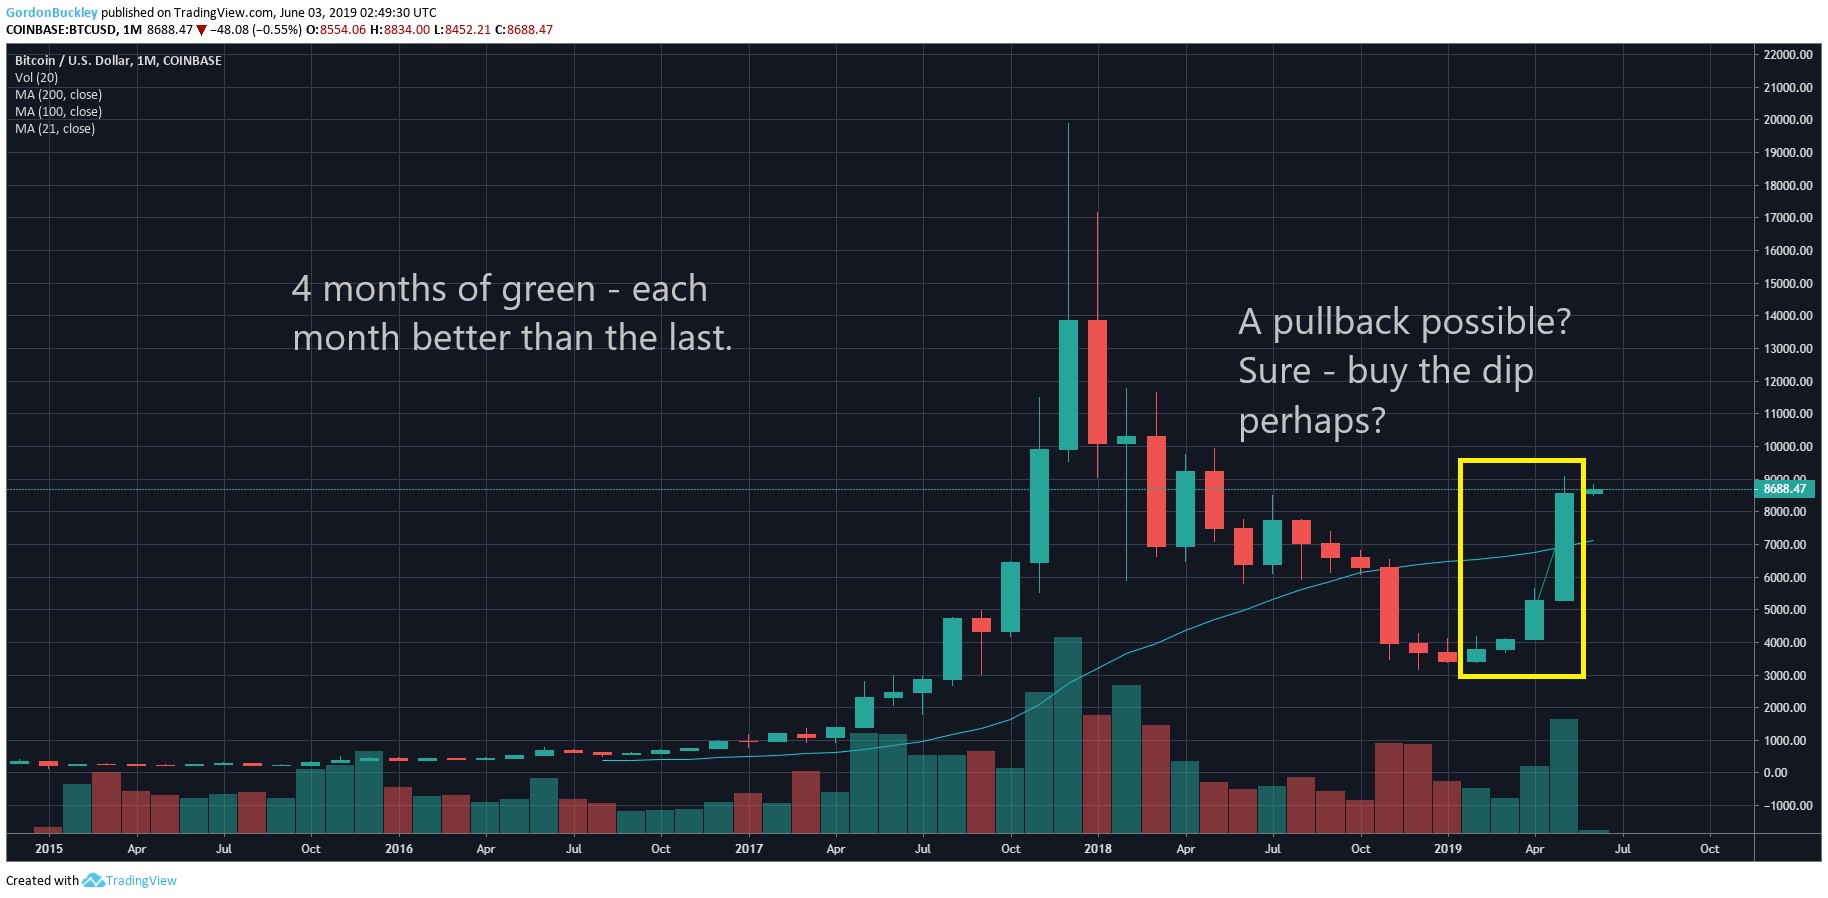
For the fourth month in a row, BTC has closed with a green monthly candle. Each candle closing stronger than the last. We are now closer to the previous all-time high (roughly 128%) than the bottom (approximately 170%).

https://www.tradingview.com/x/pRWNUKrN/

So are we due a Pullback?

Of course we are. Are we guaranteed to get one in the coming weeks? No, not at all even above typical market unpredictability.

Why not? All the typical TA indicators scream – correction.

For myself, 2 current factors serve to lessen the likelihood of an imminent (25-40% correction) which by the way I would love to see.

Institutional Money (Finally)

The possible
BITCOIN – 1 Jun

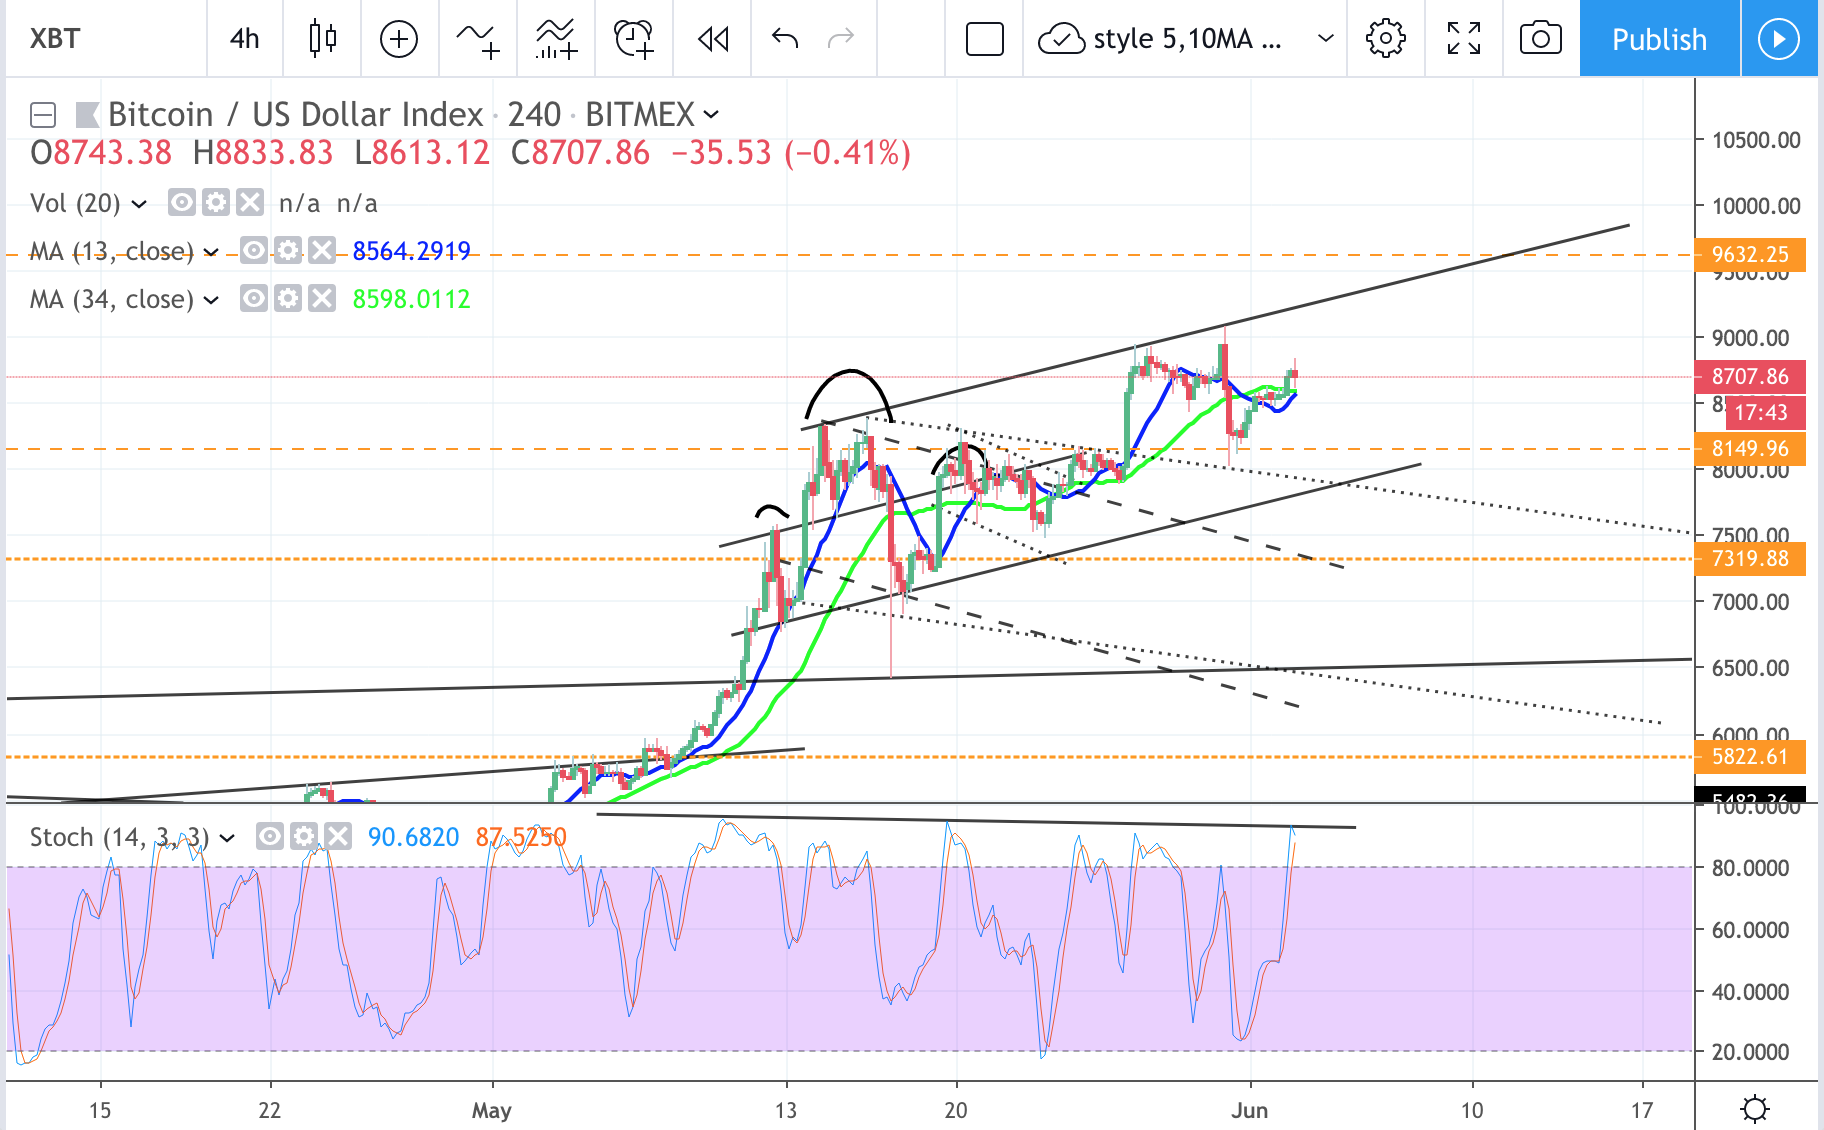
On 4hr chart, still hovering around the middle of the up channel. Stoch price looking for a downside move maybe testing the previous mentioned channel bottom 7900 zone. On hourly, looks like the price might still climb up. On weekly likely to close of long tail doji, if it closes below the week open 8732, we might see some sideway downside move next week.
News: (Current) | (Upcoming)
Short term moving average (day candle) :
RSI :
Network Value to Transactions Ratio :122
Total marketcap :275
Dominance :56
Bitfinex Margin Long/Short Volume Ratio :
Depth Chart : (S) | (R)
Weekly Timeframe :

I Told You The Smart Money Was Coming

I have been preaching for months about how the Smart Money was coming into the Crypto space because when it comes to trading, the Smart Money buy low and sell high, while the retail investor buys high and sells low.  

Bitcoin Smart Money Sentiment 8/9/18 – Smart Money Continues To Enter The Crypto Space

Evidence Smart Money Crypto Infrastructure Is Being Built

Be Patient…The Smart Money Is Coming

I recently came across an article on Cointelgraph that quantified what I was saying:

The number of wallets holding between 1,000 and 10,000 bitcoin (BTC) has seen a sharp increase since the crypto market bottomed this winter, indicating

Crypto Contest June 2: Metadium

Metadium (Bittrex: METABTC) has broken out of the triangle pattern in the daily chart.

(Chart courtesy of Tradingview.com (log scale))

Elliott Wave Analysis

In Elliott Wave terms, Metadium began a wave one advance on February 19. The red wave one (blue sub-waves i-ii-iii-iv-v) finished on March 20, and the red wave two (blue sub-waves a-b-c) correction ended on May 14. If this wave count is correct, Metadium should be heading next towards the March 20 peak in the red wave three.

(Chart courtesy of Tradingview.com (log scale))

Funnymentals

Metadium aims to build an identity blockchain ecosystem. HighOnCoins covered the latest news one week ago.

(Sources: Metadium and YouTube)

How can I vote?

The Sunday Recap – Down the Rabbit Hole 31

Up – 9k then down down and up again. The market is certainly poised for a significant break. A steep retrace seems the most likely short-term outcome but zooming out a little the bull looks in. As typical in crypto, lots of news and narratives to recap. Block.one just announced a faster EOS and a new social media platform -jury’s still out as to whether this was an ‘event’ or not.

Pick of the Week

A thorough examination of the remittance market is my pick of the week. Though this week’s podcast for the following quote alone “Quantitative easing is universal basic income

BITCOIN – 2 Jun

On 4hr chart, narrow range consolidation likely to slide down testing the previous mentioned area 7900 zone (channel bottom and previous bull flag breakout line). Possible more weakness for stoch to cycle down doing lower highs together with the price.
News: (Current) | (Upcoming)
Short term moving average (day candle) :
RSI :
Network Value to Transactions Ratio :122
Total marketcap :272
Dominance :55.9
Bitfinex Margin Long/Short Volume Ratio :
Depth Chart : (S) | (R)
Weekly Timeframe :

Crypto Contest June 1: BitUP Token

BitUP Token (Huobi: BUTBTC) has broken out of the triangle pattern in the daily chart.

(Chart courtesy of Tradingview.com (log scale))

Elliott Wave Analysis

In Elliott Wave terms, BitUP Token began a wave one advance on February 20. The red wave one (blue sub-waves i-ii-iii-iv-v) finished on April 9, and the red wave two (blue sub-waves a-b-c) correction ended on May 14. If this wave count is correct, BitUP Token should be heading next towards the April 9 peak in the red wave three.

(Chart courtesy of Tradingview.com (log scale))

Funnymentals

BitUP is a digital assets management platform. You can view their roadmap below.

(Sources: BitUP)

How can I vote? Where

Litecoin Still Trading Like a Champ!

The price action of Litecoin of late has been solid.  Basically it has held the levels it needs to hold to have the full bullish designation remain intact.
Another moment of truth
Right now LTC is testing the 108 area that it breach a few days back.  After breaking though a level a successful test is actually desired and bullish.   It also makes for a more orderly move.
So that is where price is right now.  The question is will it succeed.  So far it is holding in steady but that doesn’t guarantee it will continue to do so.
The good news is this

Bitcoin Technical Analysis: Bulls Defending Support

Bitcoin dropped over $1,100 yesterday in under 8 hours. Price wicked below the $8,150 support, but bulls quickly stepped in to play defense. It’s now trading around $8,400 on Coinbase.

The daily RSI has developed an ascending support line that’s been respected since December of last year. If this support holds, it may signal the bulls have enough strength to test $9,000 again.

In today’s video I discuss market psychology. We’ll try to make sense of the beautiful madness that is bitcoin, give you key areas to watch and so much more. I hope you find it helpful.

Video Analysis:

If you don’t see

BITCOIN – 31 May

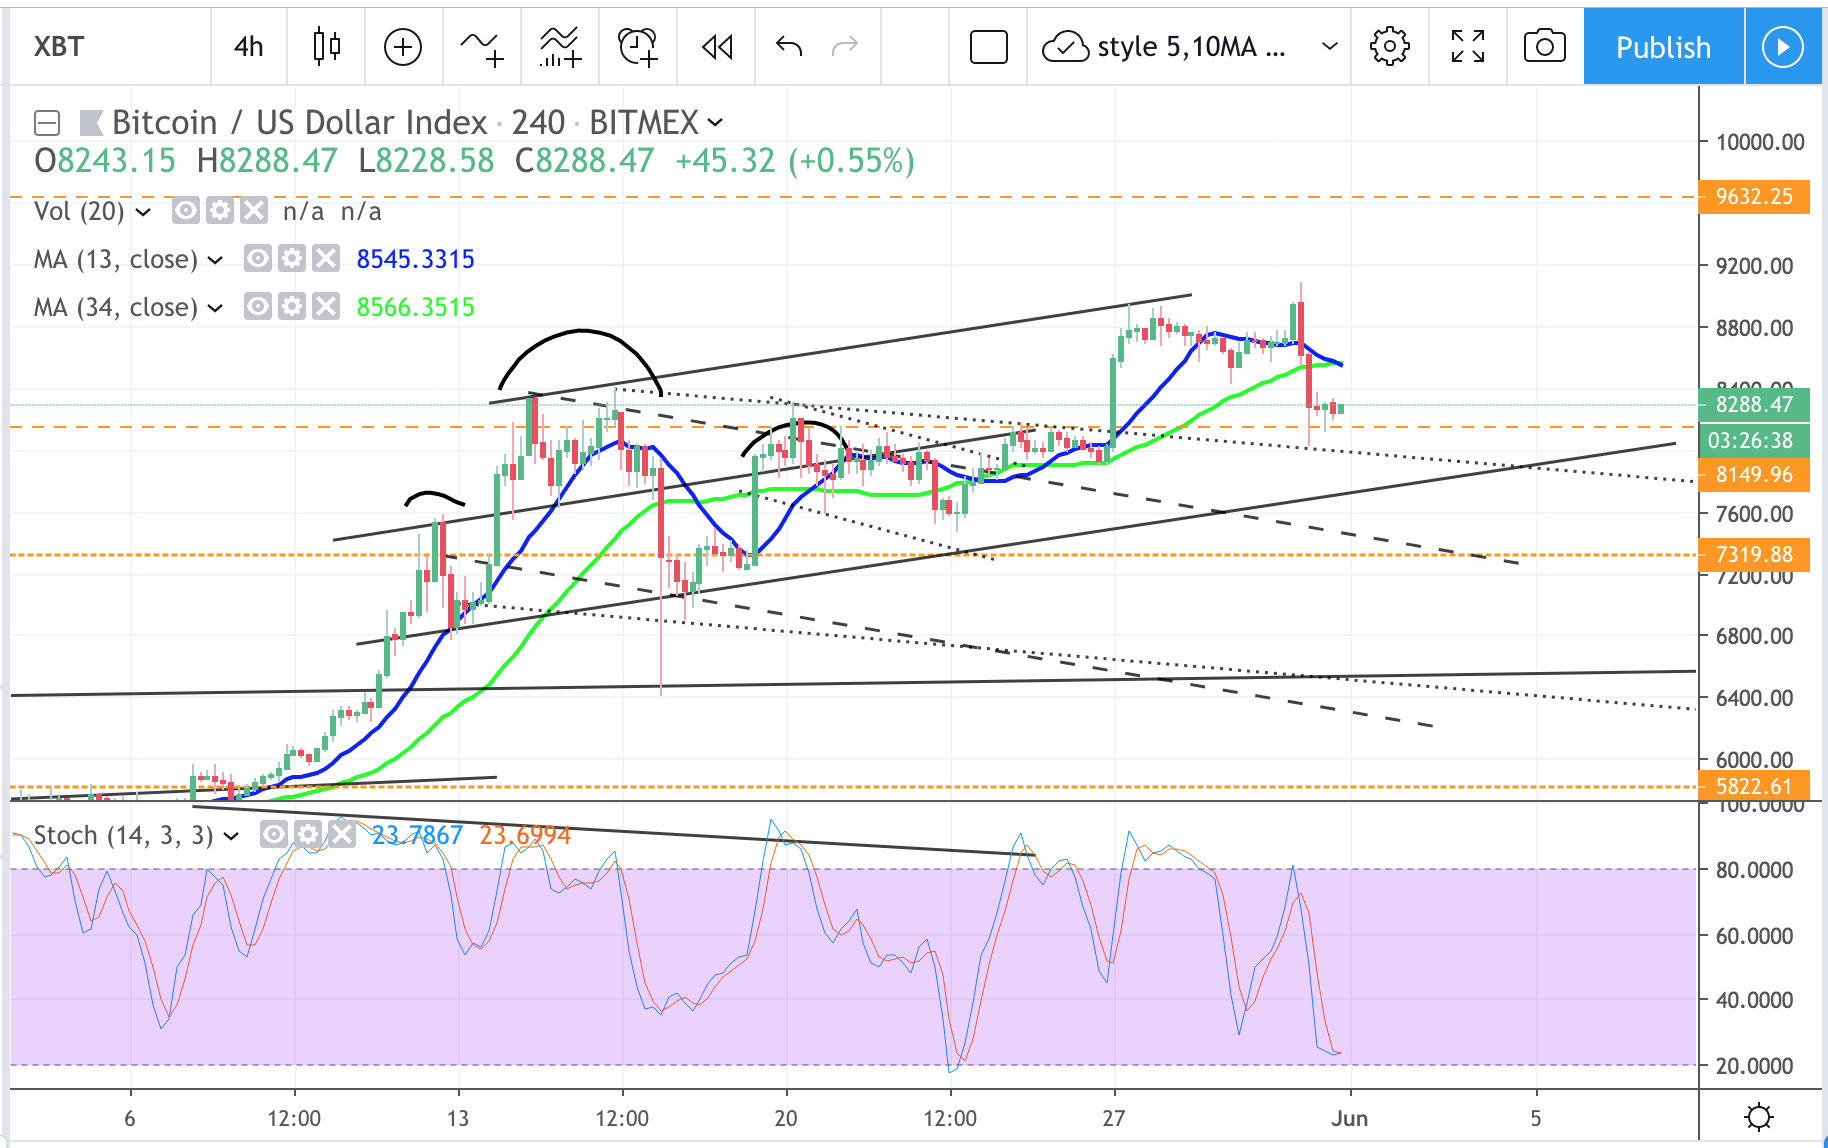
On 4hr chart, testing the SR zone of 8300. Possible to slide some more towards the channel bottom around 7900 zone. On daily chart, possible HS, neckline could be around 7300 near closing or the shadow lows around 6500 which is about the big channel breakout previously.
News: (Current) | (Upcoming)
Short term moving average (day candle) :
RSI :
Network Value to Transactions Ratio :122
Total marketcap :262
Dominance :56.1
Bitfinex Margin Long/Short Volume Ratio :
Depth Chart : (S) | (R)
Weekly Timeframe :