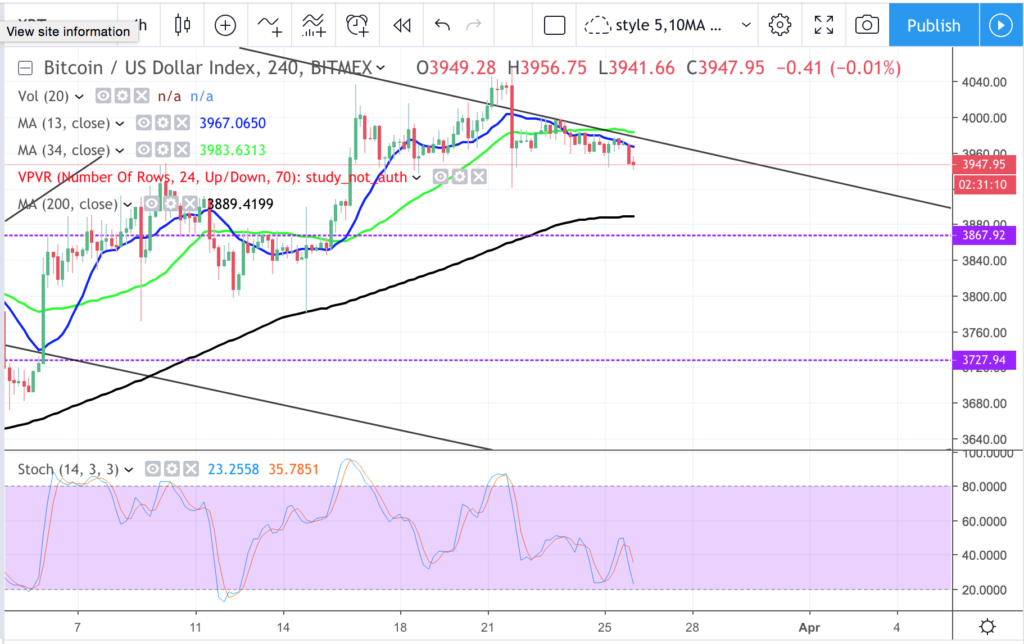
On 4hr chart, made lower lows, stoch oscillating for more room downside. Likely to break 3900. Possible mini IHS with 3950 neckline, downside tgt to test 3870 support zone.
News: (Current) | (Upcoming)
Short term moving average (day candle) :
RSI :
Network Value to Transactions Ratio :117
Total marketcap :139
Dominance :50.8
Bitfinex Margin Long/Short Volume Ratio :
Depth Chart : (S) | (R)
Weekly Timeframe :
Tag: Cryptocurrencies
Why is Bitshares Spiking? Up 25+%
Bitshares has been up as much as 30+% today on some MASSIVE Volume. I have been a big proponent of graphene based blockchains because the ability to scale and how quickly they can move transactions and confirmations. Currently bitsahres is trading over $0.063 and one of the biggest movers on coinmarketcap.
Does anyone know the reason for this spike? Was their news…or are people just getting smarter?
Granted the level is 20% from where it was a few hours ago, you now have a MASSIVE level to hold long against.
If you have any ideas for this move, leave it
Crypto Contest March 25: SpaceChain
SpaceChain (Bittrex: SPCBTC) has broken out of the triangle pattern in the daily chart.
(Chart courtesy of Tradingview.com (log scale))
Elliott Wave Analysis
In Elliott Wave terms, SpaceChain began a wave one advance on January 14. The red wave one finished on January 30, and the red wave two correction ended on February 13. The red wave three advance finished on February 26, and the red wave four correction ended on March 22. If this wave count is correct, SpaceChain should be heading next towards the February 26 peak in the red wave five.
(Chart courtesy of Tradingview.com (log scale))
One can see the wave count even better
Bitcoin – 25 March
A week ago I spoke about holding off my March BTC buy a little longer. So far this looks like a bad decision on my part (and is why one should always DYOR and never follow someone’s suggestions blindly – even when that someone is me!). I suggested this BTC price movement (seen below) – which has not happened. The false peak of late February caught me out and threw my analysis.
Fortunately I knew that I may be making a mistake at the time (so I wasn’t completely wrong) – and planned a contingency analysis scenario. In that same post I also published this
BITCOIN – 24 Mar
Exactly as mentioned denial clinging on. On 4hr chart, stoch on the lower band and maybe some breather space needed before making room for further down move. Possible upside wick again to trap. Consolidation room getting tight and lesser, next move in 1-2 days time.
On weekly it tell another story, if it hold and close above the week open of 3966, making path for possible TD9, maybe maybe we will have the formation of the big ascending triangle with baseline around 4250 zone.
News: (Current) | (Upcoming)
Short term moving average (day candle) :
RSI :
Network Value to Transactions Ratio :116
Total marketcap :140
Dominance
Crypto Contest March 24: HitChain
HitChain (Huobi: HITUSDT) has broken out of the triangle pattern in the daily chart.
(Chart courtesy of Tradingview.com (log scale))
Elliott Wave Analysis
In Elliott Wave terms, HitChain began a wave one advance on December 8, 2018. The red wave one (blue sub-waves i-ii-iii-iv-v) finished on December 24, 2018, and the red wave two (blue sub-waves a-b-c) correction ended on February 7 this year. If this wave count is correct, HitChain should be heading next towards the December 24, 2018 peak in the red wave three.
(Chart courtesy of Tradingview.com (log scale))
Funnymentals
HitChain hopes to surpass GitHub as the largest open-source platform by applying blockchain technology for a
Crypto Contest March 24: HitChain
HitChain (Huobi: HITUSDT) has broken out of the triangle pattern in the daily chart.
(Chart courtesy of Tradingview.com (log scale))
Elliott Wave Analysis
In Elliott Wave terms, HitChain began a wave one advance on December 8, 2018. The red wave one (blue sub-waves i-ii-iii-iv-v) finished on December 24, 2018, and the red wave two (blue sub-waves a-b-c) correction ended on February 7 this year. If this wave count is correct, HitChain should be heading next towards the December 24, 2018 peak in the red wave three.
(Chart courtesy of Tradingview.com (log scale))
Funnymentals
HitChain hopes to surpass GitHub as the largest open-source platform by applying blockchain technology for a
Huobi Is Taking Notes From Binance
I love Binance, not only did they take the world by storm last year and in the process became the world’s largest crypto exchange, they have a great CEO, Changpeng Zhao (aka “CZ”) and are constantly innovating.
Despite the Crypto bear market in 2018 and despite 70% of ICO projects failing, ICOs were still able to raise over $10 billion in 2018. This might be exactly why Binance launched their own ICO ecosystem called Launchpad. And it make sense…projects have immediate access to potential funding from Binance’s 10 million users.
Binance Does It Again
Huobi is a Singapore-based cryptocurrency exchange and does about $1
The Sunday Recap – Down the Rabbit Hole 21
The cryptospace is heating up again. While Bitcoin holds steady and for the time being remains stalled at 4k, the alts continue to make gains. Cardano in particular, had had a good week. Let’s see if this is just over-exuberance about a main net upgrade or the start of an uptrend for ADA. On a not so upbeat note a recent report found that 95% of Bitcoin volume is fake – critically though there are more dependable exchanges to choose from such as, Binance and Kraken. Clearly, in market terms, we have a long, long way to go.
Pick of the
EOS seems about to confirm reversal
Following the “party” initiated first by LITECOIN and then by BINANCE, EOS is presenting the perfect set up for confirming the reversal.
On the daily chart:
EOS has completed 4 out of the 5 waves up after touching the ground on early December.
The
3rd wave has fitted perfectly the 1.618 FIBONACCI level as expected and
the 4th corrective wave has been concluded in a short A-B-C correction.
In
order to confirm the REVERSAL, one of the 3 requisites has been met as
well since EOS is moving above the 50 Days Moving Average which has been
crossed on early February. The second requisite


