Crypto Contest March 21: Smartshare

Smartshare (Huobi: SSPBTC) has broken out of the triangle pattern in the daily chart.

(Chart courtesy of Tradingview.com (log scale))

Elliott Wave Analysis

In Elliott Wave terms, Smartshare began a wave one advance on November 5, 2018. The red wave one (blue sub-waves i-ii-iii-iv-v) finished on January 27 this year, and the red wave two (blue sub-waves a-b-c) correction ended on March 8. If this wave count is correct, Smartshare should be heading next towards the January 27 peak in the red wave three.

(Chart courtesy of Tradingview.com (log scale))

Funnymentals

Smartshare is a blockchain-based IoT ecosystem with 150,000 smart devices connected. You can view their official introduction video

BITCOIN – 21 Mar

Possible divergence on 4hr chart, price higher, stoch lower. Despite out of the triangle top resistance, yet to see confirmation price move/vol to support this breakout. On daily, possible continuation extended push for the baseline of big ascending triangle around 4250 zone. Thereafter might consolidate again testing this 4250 zone sideway movement till it catchup with the 200 days moving average.
News: (Current) | (Upcoming)
Short term moving average (day candle) :
RSI :
Network Value to Transactions Ratio :121
Total marketcap :141
Dominance :50.8
Bitfinex Margin Long/Short Volume Ratio :
Depth Chart : (S) | (R)
Weekly Timeframe :

Early Investors In The Cryptos Will Be Handsomely Rewarded

Ethereum (ETH) co-founder Joseph Lubin

said that he expects the global economy will be 10 times larger in 10 to 20 years, when blockchain is fully ramified, and blockchain will be involved in most of it. Lubin made the statement at the SXSW conference in Austin on March 14.

During the same keynote, Lubin also pointed out that just as nowadays there aren’t many “normal” people using blockchain-based systems, “there weren’t a lot of ‘normal’ people firing email around in 1983.”

Source

Financial institutions haven’t set up cryptocurrency bank
accounts as of yet.  Custody of crypto is
the bridge currently being built to transfer that

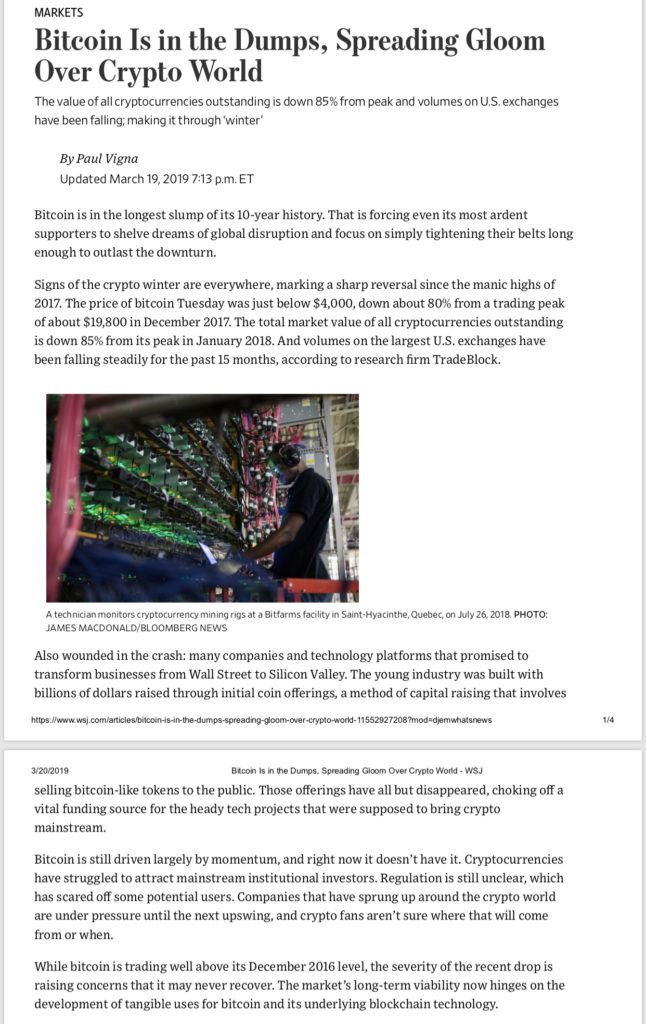
Bitcoin is in the Dumps!…

Isn’t it comical…this is the best thing about the main stream media. It gives you major turns. The mainstream media has ZERO idea what they are talking about 85% of the time. Like really Wall Street Journal? You have the audacity to write this article now? When the chart actually looks good and Bitcoin is Down 85% from highs? Lmao.

I’m not really surprised at all by this. Crypto is still in its infancy and probably inning 2 of this 9 inning game. It will come out of its 6th consecutive bottom ripping to all time highs…getcha popcorn ready. The

Bitcoin is in the Dumps!…

Isn’t it comical…this is the best thing about the main stream media. It gives you major turns. The mainstream media has ZERO idea what they are talking about 85% of the time. Like really Wall Street Journal? You have the audacity to write this article now? When the chart actually looks good and Bitcoin is Down 85% from highs? Lmao.

I’m not really surprised at all by this. Crypto is still in its infancy and probably inning 2 of this 9 inning game. It will come out of its 6th consecutive bottom ripping to all time highs…getcha popcorn ready. The

Crypto Contest March 20: LinkEye

LinkEye (Huobi: LETUSDT) has broken out of the triangle pattern in the four-hour chart.

(Chart courtesy of Tradingview.com (log scale))

Elliott Wave Analysis

In Elliott Wave terms, LinkEye began a wave one advance on January 28 this year. The red wave one finished on February 24, and the red wave two correction ended on March 4. The red wave three advance finished on March 10, and the red wave four correction ended on March 14. If this wave count is correct, LinkEye should be heading next towards the March 10 peak in the red wave five.

(Chart courtesy of Tradingview.com (log scale))

Zooming out in the daily chart,

ENJ – still going strong

Enjincoin (ENJ) has made remarkable upwards leaps and bounds over the last month, putting even well performing coins such as BNB to shame. So what’s the clever play now? Sell it? Buy it? Hold it?

I’m holding mine. Here is why:

They say lightning doesn’t strike twice. They’re wrong. 

Within a time period of a mere two weeks, ENJ more than doubled in value, not once, but twice!

Made by Bit Brain with TradingView

Three weeks ago (just after the first big climb) I made a comment on someone else’s ENJ post. I was then asked:

“Haven’t you sold ENJ at this price?”

To which my answer was:

“A

BITCOIN – 20 Mar

On 4hr chart, its at the channel top resistance now. Unlikely to break above, maybe shadow wick up for fake breakout of the big triangle. Likely to be denial for consolidation within this top resistance and 3870 support forming a possible mini descending triangle before heading down.
News: (Current) | (Upcoming)
Short term moving average (day candle) :
RSI :
Network Value to Transactions Ratio :121
Total marketcap :139
Dominance :50.9
Bitfinex Margin Long/Short Volume Ratio :
Depth Chart : (S) | (R)
Weekly Timeframe :

Stellar Lumens (XLM)- Worth Buying Into?

As life re-enters the cryptosphere, its time to dust off a few projects and examine whether they provide an investmnet opportunity. If you have been into crypto for any period of time, you are likely aware of Stellar. It has just rebranded, ditching the ‘oh so 2017’ rocket logo for a more abstract, professional design. Given the rebrand, it seemed high-time to delve back into Stellar.

The Charts

Let’s have a look at the Stellar charts.

All-Time Chart

https://coinmarketcap.com/currencies/stellar/

Looking at the complete chart a couple of things leap out. Stellar is about to retest BTC resistance going back to June 2017. Breaking through or

Bitcoin Technical Analysis: Still Pounding on Resistance

Bitcoin has been pounding on the $4,000 resistance these past 4 days. Daily volume remains relatively strong at about $9.3 billion.

Zooming in on the 4 hour chart, it appears a bull flag is forming. We’re also seeing hidden bullish divergence on the 4 hour MACD. This suggests a break up to test the upper portion of resistance around $4,120 (on Coinbase).

In todays analysis I discuss, key areas to watch, where price may be heading next, traps to avoid and so much more. I hope you find it helpful.

Video Analysis:

If you don’t see the above video, navigate to TIMM (https://mentormarket.io/workin/) or