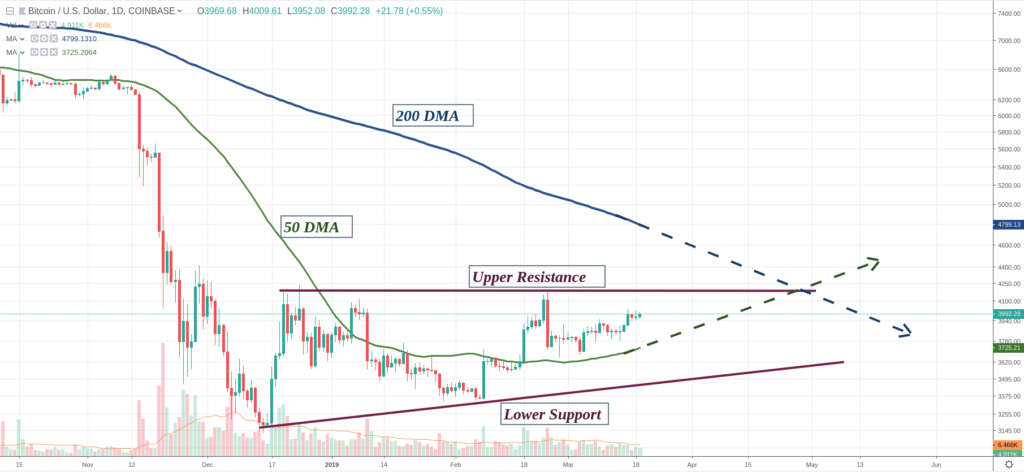
BITCOIN: the “umpteenth” tentative…

I have the suspicious that after almost 1 month of a very
boring market BITCOIN is very close to what I call “Decision” point.
This is the point on which Bulls and Bears measures their strengths and
define which way to take next.

On the Daily Chart:

BTC is still far from the “Golden Crossing”
on which both Daily Moving Average lines (50 and 200) would meet. The
extrapolated lines project April 28th as a more likely date for that to
happen…

We have seen a series of Higher Highs which is a
good sign of recovery but what we really need

$EOS Update: Very Constructive HIGHER LOWS in #crypto land

EOS is holding higher folks. My favorite crypto currency with a very LOFTY price target of $100 on the next mega bull run. You can see here off of the December 2018 lows (ironically a year removed from the top) we are looking very very good. I am expecting an explosion through highs IF we take out $4 on volume!

Here We Go!

Crypto Contest March 19: Achain

Achain (Huobi: ACTUSDT) has broken out of the triangle pattern in the daily chart.

(Chart courtesy of Tradingview.com (log scale))

Elliott Wave Analysis

In Elliott Wave terms, Achain began a wave one advance on January 11 this year. The red wave one finished on January 13, and the red wave two correction ended on January 28. The red wave three advance finished on February 23, and the red wave four correction ended on March 11. If this wave count is correct, Achain should be heading next towards the February 23 peak in the red wave five.

(Chart courtesy of Tradingview.com (log scale))

Funnymentals

Achain is a public blockchain

Litecoin: where should you sell?

It’s been a good quarter for LTC: ever since mid December 2018 LTC has been gaining on BTC. But since we know that what goes up must come down; where/when should we sell our LTC?

The current LTC climb is a strong one. I say this because LTC is typified by short, sharp price climbs and long, slow price falls thereafter. The current climb is slow and steady, which leads me to believe that it may be a particularly strong one. (See the CMC chart below):

From https://coinmarketcap.com/currencies/litecoin/

Because this climb is looking particularly strong, it is my suggestion that you sell LTC

BITCOIN – 19 Mar

Still trying for the breakout on the triangle top but still feels weak. Likely more denial clinging along the triangle top or consolidation between triangle top and the support zone around 3870. Likely to pullback/swing back to triangle maybe testing triangle bottom. On weekly price isn’t catching up with the stoch.
News: (Current) | (Upcoming)
Short term moving average (day candle) :
RSI :
Network Value to Transactions Ratio :126
Total marketcap :139
Dominance :50.9
Bitfinex Margin Long/Short Volume Ratio :
Depth Chart : (S) | (R)
Weekly Timeframe :

BTC: Not putting my money where my mouth is

I was faced with a very difficult decision this past weekend: Buy BTC or don’t buy BTC.

Last month I described a crypto buying process ( “Buy crypto now! – Like this:” ), a process which I believe best suits the current market conditions. Because it is an optimal buying-in strategy, I have been trying hard to stick to it. However, some unfortunate local circumstances have created a sudden urgency in my need to acquire more BTC. Due to my particular financial situation, these circumstances will not apply to you, but what I have learnt from this situation may well assist

Crypto Contest March 18: BitTorrent

BitTorrent (Binance: BTTUSDT) has broken out of the triangle pattern in the daily chart.

(Chart courtesy of Tradingview.com (log scale))

Elliott Wave Analysis

In Elliott Wave terms, BitTorrent began a wave one advance on January 31 this year. The red wave one (blue sub-waves i-ii-iii-iv-v) finished on February 5, and the red wave two (blue sub-waves a-b-c) correction ended on March 8. If this wave count is correct, BitTorrent should be heading next towards the February 5 peak in the red wave three.

(Chart courtesy of Tradingview.com (log scale))

Funnymentals

BitTorrent aims to tokenize the decentralized file-sharing protocol with their cryptocurrency asset. You can find some more details from

New Weekly Candle: And the Show Goes On!

We have a new crypto week on our hands. And anyone with half a non emotional trading brain can look st the charts and know “the show goes on” baby!

Litecoin Ian leading the way and I have been on this for a few weeks hitting it dead nuts . I may have been struggling a little with equities, but I love crypto more anyways . Good luck out there! My favorites…

BTC

BAT

EOS

LTC

Crypto Contest March 17: SmartMesh

SmartMesh (Huobi: SMTETH) has broken out of the triangle pattern in the weekly chart.

(Chart courtesy of Tradingview.com (log scale))

Elliott Wave Analysis

In Elliott Wave terms, SmartMesh began a wave one advance in December 2017. The red wave one (blue sub-waves i-ii-iii-iv-v) finished in January 2018, and the red wave two (blue sub-waves a-b-c) correction ended in December 2018. If this wave count is correct, SmartMesh should be heading next towards the January 2018 peak in the red wave three.

(Chart courtesy of Tradingview.com (log scale))

Funnymentals

SmartMesh will build P2P mesh networks that run parallel to the international Internet based on intelligent hardware, software and protocols. You

BITCOIN – 17 Mar

Adjusted the big triangle top, seem like it still fit from previous shadow high. Tested and touched the triangle top now, might still cling along the top next few days and retest the previous support zone 3870 for a possible mini descending triangle. Possible pullback test to around 3500 on triangle bottom.
News: (Current) | (Upcoming)
Short term moving average (day candle) :
RSI :
Network Value to Transactions Ratio :118
Total marketcap :139
Dominance :50.8
Bitfinex Margin Long/Short Volume Ratio :
Depth Chart : (S) | (R)
Weekly Timeframe :