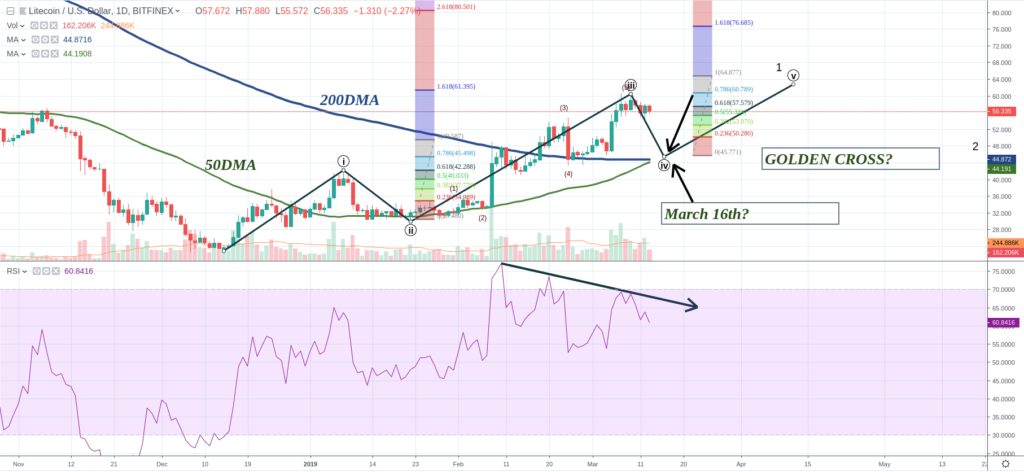
LITECOIN: a Bearish Divergence knocking on the “Golden Cross” Door

Market is keeping its boring steady state movement as BITCOIN does
while altcoins seems going back and forth alternatively day by day…

Well,
not all of them, major altcoins as BINANCE are really independent from
this behavior, In the case of BINANCE I am keeping my bullish sentiment
constant.

Also LITECOIN has demonstrated a very
interesting rise, not related to the Crypto King, BITCOIN, but,
unfortunately now I am obliged to tell you what I see in its chart which
is not bad but very necessary in order for LITECOIN to keep a proper
and sustained growth.

Where is LITECOIN now?

It is, as

BITCOIN – 13 Mar

Pretty much same sentiment as yesterday, limited upside towards triangle top resistance. Seem tough on current resistance too 3870 zone. More room for downside move. Margin shorts picking up.
News: (Current) | (Upcoming)
Short term moving average (day candle) :
RSI :
Network Value to Transactions Ratio :121
Total marketcap :134
Dominance :51.2
Bitfinex Margin Long/Short Volume Ratio :
Depth Chart : (S) | (R)
Weekly Timeframe :

Bit Brain’s not-so-little guide to Holochain – Part 4

Welcome to the fourth and final part of my series on Holochain from the Trybe Holochain competition. In case you missed them, you can catch up on Parts 1 & 2 here:

Bit Brain’s not-so-little guide to Holochain – Part 1 (Introduction to Holochain)Bit Brain’s not-so-little guide to Holochain – Part 2 (Holochain, Holo, Holo fuel and HOT) Bit Brain’s not-so-little guide to Holochain – Part 3 (Holochain as a business entity)

Today we wrap up by looking at all the other aspect of Holochain which we haven’t covered yet, including the all important performance of the cryptocurrency itself. I’ll also

Crypto Contest March 13: Zcoin

Zcoin (Bittrex: XZCUSD) has broken out of the triangle pattern in the weekly chart.

(Chart courtesy of Tradingview.com (log scale))

Elliott Wave Analysis

In Elliott Wave terms, Zcoin began a wave one advance in November 2016. The red wave one (blue sub-waves i-ii-iii-iv-v) finished in December 2017, and the red wave two (blue sub-waves a-b-c) correction ended in December 2018. If this wave count is correct, Zcoin should be heading next towards the December 2017 peak in the red wave three.

(Chart courtesy of Tradingview.com (log scale))

Funnymentals

Zcoin is an open-source privacy-focused cryptocurrency token that launched in September 2016. They announced yesterday that Zcoin is now spendable

Crypto Contest March 13: Zcoin

Zcoin (Bittrex: XZCUSD) has broken out of the triangle pattern in the weekly chart.

(Chart courtesy of Tradingview.com (log scale))

Elliott Wave Analysis

In Elliott Wave terms, Zcoin began a wave one advance in November 2016. The red wave one (blue sub-waves i-ii-iii-iv-v) finished in December 2017, and the red wave two (blue sub-waves a-b-c) correction ended in December 2018. If this wave count is correct, Zcoin should be heading next towards the December 2017 peak in the red wave three.

(Chart courtesy of Tradingview.com (log scale))

Funnymentals

Zcoin is an open-source privacy-focused cryptocurrency token that launched in September 2016. They announced yesterday that Zcoin is now spendable

BTC Short-term 13 March

A small short-term BTC price movement forecast – compliments of yours truly

From big to small:

The large converging triangle is still in play – this apex of this triangle lies in mid-July (solid white lines).BTC is still moving downwards after it’s last trip up above $4000. I expect a bounce around $3600 (solid yellow lines).Interim BTC movements are in a North-Easterly direction and are accordance with diagonal Fib levels.

Made by Bit Brain with TradingView

The bigger picture looks like this:

Made by Bit Brain with TradingView

In the short-term I expect a BTC movement something like this. Volume is dropping again so

Two Minute Crypto – I Like My Investment Charts Raw

Please click the link below to listen to the 30th episode of my weekly crypto podcast ‘Two Minute Crypto.’ These are intended to be short, single-topic ramblings on some aspect of the cryptosphere. Comments and critiques welcome.

External Links:

https://itunes.apple.com/au/podcast/two-minute-crypto-raw-investment-charts/id1441492450?i=1000431675248&mt=2

Or

https://www.podbean.com/media/share/pb-96wak-aaa810

Transcript

Two Minute Crypto – I Like My Investment Charts Raw

Welcome to Two Minute Crypto – I like my investment charts raw and here’s why. When I’m making an investment decision with a long-term horizon, I strip the relevant charts back to the barest possible details. Price over time and volume. I’m addicted to volume – I admit it and miss it on

It’s being a long time since I last speak about BITSHARES and I think it deserves a following up post… also because seems to me that BITSHARES has bottomed already a few weeks ago according to the daily chart I show you below:

According to this chart,
BTS touched its lowest point by the end of November last year…
Actually, it did touch the bottom twice, the second time the end of
January this year.

What is most interesting to see is
that, even if BTS touched twice the same ground, the RSI indicator
marked a prominent DIVERGENCE, which is a clear

Bit Brain’s not-so-little guide to Holochain – Part 3

Welcome to Part 3 of my series on Holochain. In case you missed them, you can catch up on Parts 1 & 2 here:

Bit Brain’s not-so-little guide to Holochain – Part 1 (Introduction to Holochain)Bit Brain’s not-so-little guide to Holochain – Part 2 (Holochain, Holo, Holo fuel and HOT)

Today we look at Holochain as a business entity before branching out a little into some of the Holochain ecosystem periphery:

Holochain as a business entity

We will analyse the clues available to us about how Holochain is being run from a business perspective. We will also swing around back to Holo and look

BITCOIN – 12 Mar

On 4hr chart, still doing it’s narrow range consolidation. Making lower lows, lower highs. Limited upside towards the big triangle top resistance around 4000 zone. Unlikely to break thru, maybe fake wicks outside. Weekly still manage to close off green but stoch and price looking heavy for turn.
News: (Current) | (Upcoming)
Short term moving average (day candle) :
RSI :
Network Value to Transactions Ratio :121
Total marketcap :134
Dominance :51.4
Bitfinex Margin Long/Short Volume Ratio :
Depth Chart : (S) | (R)
Weekly Timeframe :
