Crypto Contest February 15: Crypto.Com

Crypto.com (Bittrex: MCOBTC) has broken out of the triangle pattern in the weekly chart.

 (Chart courtesy of Tradingview.com (log scale))

Elliott Wave Analysis

In Elliott Wave terms, Crypto.com began a wave one advance in July 2017. The red wave one (blue sub-waves i-ii-iii-iv-v) finished in August 2017, and the red wave two (blue sub-waves a-b-c) correction ended in November 2018. If this wave count is correct, Crypto.com should be heading next towards the August 2017 peak in the red wave three.

(Chart courtesy of Tradingview.com (log scale))

Funnymentals

Crypto.com, formerly known as Monaco, intends to offer payment card products that allow consumers to borrow and spend cryptocurrency

Diversify!

I often shout “Diversify!” when I speak about crypto, I even wrote a few posts specifically on that topic. I’m known for keeping a ridiculously over-diversified crypto portfolio that’s not very easy to track and manage (we’re talking way in excess of 50 cryptos here).

But is that all there is to diversification? Hold a lot of different cryptos – spread the risk and maximise the chances of finding something with good ROI – sell the ones that Moon and buy cheap (good) ones in their place?

Well – yes. That’s pretty much exactly what you should do.

Made by Bit Brain. Yes

Turns Out I was Right…Jamie Dimon and his Weasel Move

It wasn’t that long ago that you saw this…“Jamie Dimon Slams Bitcoin as a Fraud”

As soon as this hit the news wire I had a feeling that Dimon was attempting to pull one of his weasel banker moves that banks pull daily througout the financial markets. See this is how it works. Banks funnel news in order to set up the actual move of the direction of the asset (which they know many times based on the inside sources and collaboration with other banks). In this case here is how it played…

Bitcoin had left the station “at the time” and

Crypto Contest February 14: Stealth

Stealth (Bittrex: XSTUSD) has broken out of the triangle pattern in the weekly chart.

(Chart courtesy of Tradingview.com (log scale))

Elliott Wave Analysis

In Elliott Wave terms, Stealth began a wave one advance in November 2015. The red wave one finished in October 2016, and the red wave two correction ended in January 2017. The red wave three (blue sub-waves i-ii-iii-iv-v) advance finished in January 2018, and the red wave four (blue sub-waves a-b-c) correction ended in November 2018. If this wave count is correct, Stealth should be heading next towards the January 2018 peak in the red wave five.

(Chart courtesy of Tradingview.com

Crypto Contest February 14: Stealth

Stealth (Bittrex: XSTUSD) has broken out of the triangle pattern in the weekly chart.

(Chart courtesy of Tradingview.com (log scale))

Elliott Wave Analysis

In Elliott Wave terms, Stealth began a wave one advance in November 2015. The red wave one finished in October 2016, and the red wave two correction ended in January 2017. The red wave three (blue sub-waves i-ii-iii-iv-v) advance finished in January 2018, and the red wave four (blue sub-waves a-b-c) correction ended in November 2018. If this wave count is correct, Stealth should be heading next towards the January 2018 peak in the red wave five.

(Chart courtesy of Tradingview.com

Crypto Contest February 14: Stealth

Stealth (Bittrex: XSTUSD) has broken out of the triangle pattern in the weekly chart.

(Chart courtesy of Tradingview.com (log scale))

Elliott Wave Analysis

In Elliott Wave terms, Stealth began a wave one advance in November 2015. The red wave one finished in October 2016, and the red wave two correction ended in January 2017. The red wave three (blue sub-waves i-ii-iii-iv-v) advance finished in January 2018, and the red wave four (blue sub-waves a-b-c) correction ended in November 2018. If this wave count is correct, Stealth should be heading next towards the January 2018 peak in the red wave five.

(Chart courtesy of Tradingview.com

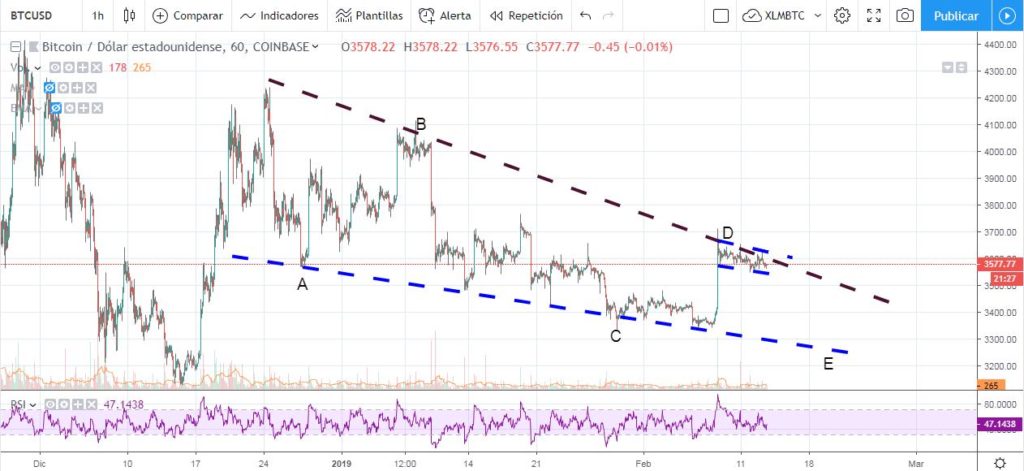
BITCOIN: either a “Bull” Flag or “BART” Flag

A few days have gone since I have posted about BITCOIN and , to tell you the truth, I felt like it did not deserve to do so till now.

Market is in “consolidation” mode, trying to decide which way to take now and the volume has kept constant since almost 5 days ago, stuck around 6.5 b$ which is not bad since it was 5b$ just a week ago…

As expected, BITCOIN has been dancing and still is doing so just below the upper line of the falling wedge.

It is true that 5 days ago I expected a continuation of the

Bitcoin and EOS Technical Analysis: BREAKOUT LOOMING?

Bitcoin continues to consolidate, but is showing numerous signs of a possible breakout. I discuss this further in my video analysis at the bottom.

EOS has been trying to break above the $3.00 resistance. While it’s briefly penetrated by a wick, a decisive break above has been unsuccessful. Volume has been slowly rising and, like bitcoin, we are seeing signs of a possible breakout in the near future.

In today’s video analysis I discuss where prices may be heading, traps to avoid and so much more. I hope you find it helpful.

Video Analysis:

If you don’t see the above video, navigate to TIMM

Crypto Contest February 13: Odyssey

Odyssey (Bittrex: OCNBTC) has broken out of the triangle pattern in the daily chart.

(Chart courtesy of Tradingview.com (log scale))

Elliott Wave Analysis

In Elliott Wave terms, Odyssey began a wave one advance on August 14, 2018. The red wave one (blue sub-waves i-ii-iii-iv-v) finished on October 17, 2018, and the red wave two (blue sub-waves a-b-c) correction ended on February 10 this year. If this wave count is correct, Odyssey should be heading next towards the October 17, 2018 peak in the red wave three.

(Chart courtesy of Tradingview.com (log scale))

Funnymentals

Odyssey’s mission is to build the next-generation decentralized sharing ecomony & peer-to-peer ecosystem. Odyssey

Latest BTC prediction holding strong

A prediction of mine from 8 Feb is right so far.

I published it in my Fib levels post of 10 Feb. I might as well milk it for all it’s worth while it remains correct!

This is the chart I’ve been using – the arrows are unchanged since I first drew them.

Made by Bit Brain with TradingView

Why am I showing you this now? To demonstrate how good I am? No – that’s not it. Okay, that is it a little bit, but there is more to it than that!

There is much excitement in the crypto world at the moment. People