BTC/Crypto Fib level-based analysis

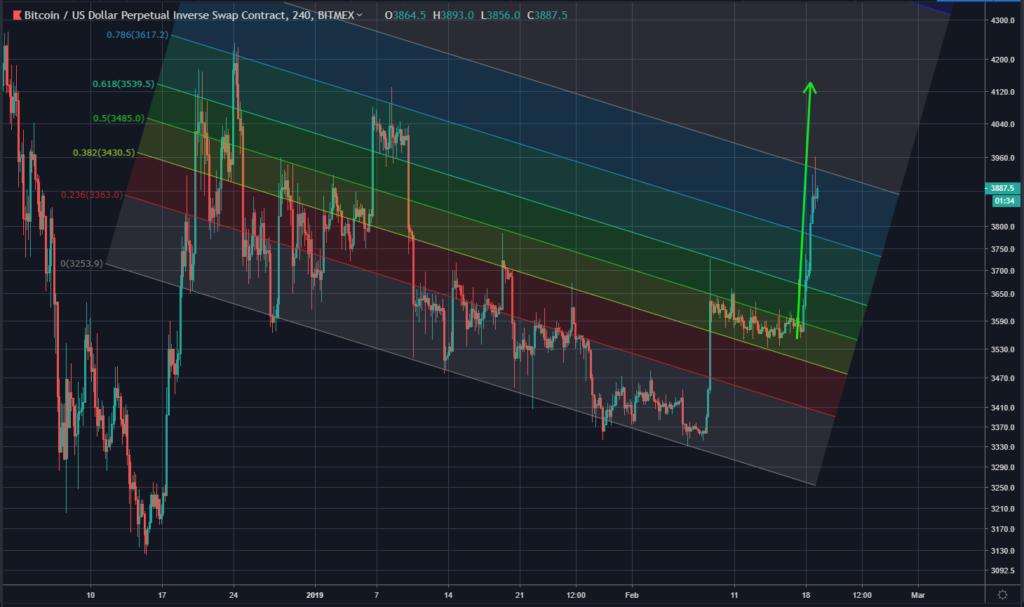
With the rapid spike in crypto prices, it’s my job to attempt to predict the next move in the markets. I’m attempting that by means of Fib analysis.

Let’s start with my previous prediction:

On 10 Feb I wrote this post – also about BTC Fib levels (as you can probably tell from the title!): Bitcoin – Fib levels. In that post I predicted price drops to previous levels – on charts such as this one:

or even this one for capitulation events:

…but knowing crypto like I do: I included these clauses:

For the record: I estimate that BTC will do something similar to what is shown on
Bitcoin: More Price Changes, The More It Stays the Same

It is always nice to see an uptick in the crypto market.  Bitcoin had a nice day yesterday and is slightly higher today.  However, has price action changed at all?
More Price Changes, The More it Stays the Same
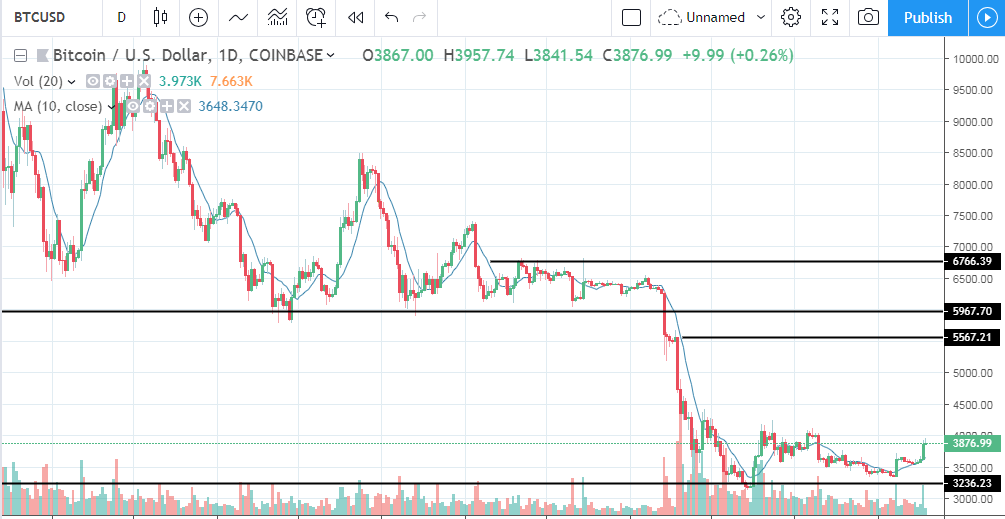
When you look at the bitcoin daily chart you see we are still firmly in the trading range of the last couple months.
Price needs to establish above 4,200 before we can see any true change in the current trading theme.
If that were to happen then we have upside all the way too 5,500 as evidence in the prior consolidation before the big drop

Crypto: Keep your head

Much has happened in crypto these last few days. It’s important to see things in perspective and to be realistic. I can help explain the market fundamentals from the correct perspective.

The market is busy, it’s very busy. In fact – I have 11 browser tabs open right now, 1 to type this post and 10 for crypto. I’m actively trading in two of them.

Take a look at what I think is important:

Our old friend Jamie Dimon

The JP Morgan CEO made a lot of news for releasing his own cryptocurrency last week. Some saw this as typical banker behaviour: doing one

Trybe TV – Bitcoin Technical Analysis: BREAKOUT IN PRICE AND VOLUME

Bitcoin has broken above the $3,600 resistance, and is now testing $3,800. This breakout was backed by a very bullish increase in volume. Looking at the daily MACD, we’re seeing some slight bearish divergence. This suggests we could see a pull back. Should that happen, I’d watch for support around $3,700-$3,650. The daily chart also…
Read on Trybe

Bitcoin Technical Analysis: BREAKOUT IN PRICE AND VOLUME

Bitcoin has broken above the $3,600 resistance, and is now testing $3,800. This breakout was backed by a very bullish increase in volume.

Looking at the daily MACD, we’re seeing some slight bearish divergence. This suggests we could see a pull back. Should that happen, I’d watch for support around $3,700-$3,650.

The daily chart also shows price breaking above the 50 day MA. If the daily candle closes above the 50 day MA, it’ll be a good indication this latest breakout has legs…at least temporarily.

In today’s video analysis I go a little more in-depth. I discuss market psychology, where price may go

Crypto Contest February 18: Lunyr

Lunyr (Bittrex: LUNBTC) has broken out of the triangle pattern in the weekly chart.

(Chart courtesy of Tradingview.com (log scale))

Elliott Wave Analysis

In Elliott Wave terms, Lunyr began a wave one advance in December 2017. The red wave one (blue sub-waves i-ii-iii-iv-v) finished in January 2018, and the red wave two (blue sub-waves a-b-c) correction ended in September 2018. If this wave count is correct, Lunyr should be heading next towards the January 2018 peak in the red wave three.

(Chart courtesy of Tradingview.com (log scale))

Funnymentals

Lunyr is an Ethereum-based decentralized crowdsourced encyclopedia which rewards users with app tokens for peer-reviewing and contributing information.

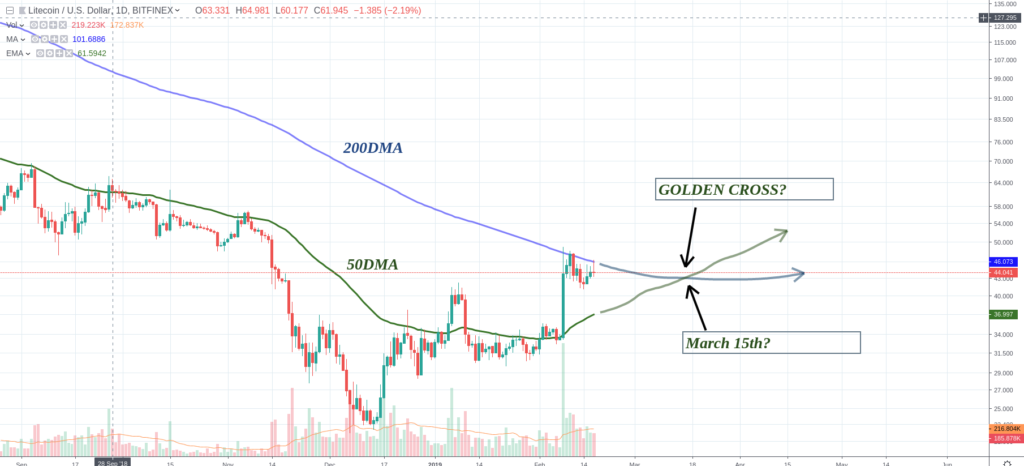
LITECOIN: How far from the “Golden Cross”

For those who do not know, the “The Golden Cross” is a Candle-stick pattern which indicates a long-term Bull Market going forward.

It occurs when a short-term moving average crosses over a major long-term moving average to the upside and it is very used by investors, analyst and traders as an indication of a major upward turn in a market.

Normally, the two moving averages used are the 50-Day MA and the 200-Day MA.

When the 50 DMA crosses the 200 DMA to the upside this is called GOLDEN CROSS…. Worth to say that also the contrary would indicate that the Bear Market is

Crypto Contest February 17: Storj

Storj (Bittrex: STORJUSD) has broken out of the triangle pattern in the weekly chart.

 (Chart courtesy of Tradingview.com (log scale))

Elliott Wave Analysis

In Elliott Wave terms, Storj began a wave one advance in July 2017. The red wave one (blue sub-waves i-ii-iii-iv-v) finished in December 2017, and the red wave two (blue sub-waves a-b-c) correction ended in December 2018. If this wave count is correct, Storj should be heading next towards the December 2017 peak in the red wave three.

(Chart courtesy of Tradingview.com (log scale))

Funnymentals

Storj aims to become a cloud storage platform that can’t be censored or monitored, or have downtime. Crypto

BITCOIN: testing the Upper trend-line

8 days have passed already from the last rise and the market seems reacting extremely stable.

Total Market cap blocked around 121 b$ and no signs of pump-dumps around… Thought this is good, some stabilization is needed for the market in order to recover the investors confidence.

The last few hours we have noted a shy change of trend, slightly upwards which is good because BITCOIN may complete the 5th wave if it manage to break the upper trend-line of a long bull flag.

If so, 5 small subwaves would form this last 5th wave. Applying some FIBO levels we could envisage 3722

Crypto Contest February 16: Waves

Waves (Bittrex: WAVESUSD) has broken out of the triangle pattern in the daily chart.

 (Chart courtesy of Tradingview.com (log scale))

Elliott Wave Analysis

In Elliott Wave terms, Waves began a wave one advance on November 25, 2018. The red wave one (blue sub-waves i-ii-iii-iv-v) finished on December 20, 2018, and the red wave two (blue sub-waves a-b-c) correction ended on January 22 this year. If this wave count is correct, Waves should be heading next towards the December 20, 2018 peak in the red wave three.

(Chart courtesy of Tradingview.com (log scale))

Looking at the monthly chart, I believe Waves is currently in the red