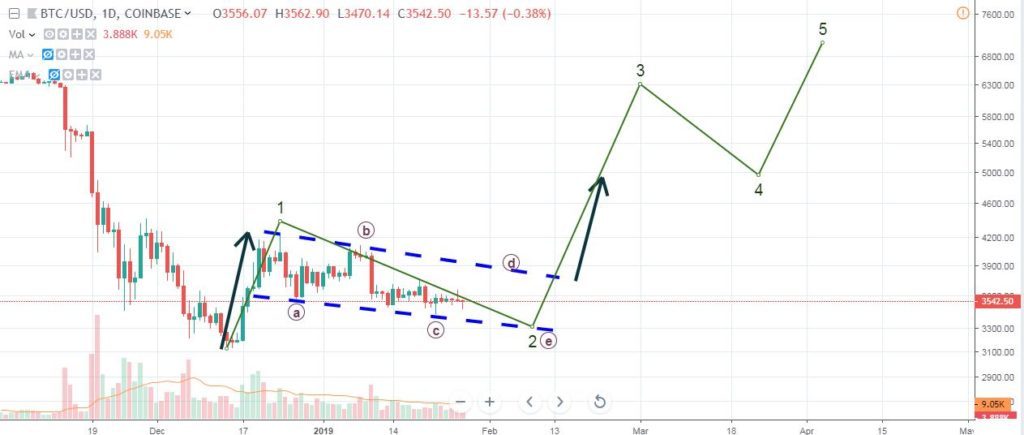
BITCOIN: another possibility…

With such a tiny volume is being really difficult to find any indication that show us the next move of BITCOIN and so, the direction of the Market.
The positive view now is that BITCOIN is still within the correction of a first wave within an upwards cycle…hopefully.
BITCOIN may be forming just a long Bull-flag, ending the wave 2 as I show you below:

Breakage of this Bull-flag upwards could be on (d) or after rebounding on (e)…
The upper Dashed line is marking the limit… we have to pay attention to that line because it is very likely that BTC has already

BITCOIN: Price projection using Bars Pattern. Just for Fun… :-)

Using BITCOIN Weekly Chart, Log Scale.Applying tool “Bars Pattern” of the previous BEAR/BULL Market, period from November 25th 2013 till December 18th 2017

Assuming End of Previous BEAR Market by end of August 2015Fitting and adjusting “Peak to Peak” with the summit of the last Bull (December 18th 2017):

Conclusions:

Still a lower low would be expected. “Simulation” of the “Bars Pattern” indicates 2548 USD as the lowest point.A “Consolidation” period of 7 to 8 months would be expected.Start of A Bull Market September 2019322.000 USD by the end of 2021…in the meantime, lots of Dapps, crypto projects and adoption coming…

Will you have the patience to

BITCOIN: Price projection using Bars Pattern. Just for Fun… :-)

Using BITCOIN Weekly Chart, Log Scale.
Applying tool “Bars Pattern” of the previous BEAR/BULL Market, period from November 25th 2013 till December 18th 2017

Assuming End of Previous BEAR Market by end of August 2015
Fitting and adjusting “Peak to Peak” with the summit of the last Bull (December 18th 2017):

Conclusions:

Still a lower low would be expected. “Simulation” of the “Bars Pattern” indicates 2548 USD as the lowest point.
A “Consolidation” period of 7 to 8 months would be expected.
Start of A Bull Market September 2019
322.000 USD by the end of 2021
…in the meantime, lots of Dapps, crypto projects and adoption coming…

Will you have the patience to

STEEM: Crossing 200 DMA?

After more than a week of amazing performance, STEEM has reached the level of the 200 DMA at the STEEM/BTC pair.

Typically, crossing that line would indicate a very good signal of reversal trend.

We have to be very attentive right now.

If STEEM manages to break that 200 DMA, it would be very likely that a higher price will be reached…

Taking into account as well all the positiveness I have now (LoL), I would consider as well the following CUP & HANDLE Pattern another good signal which corroborates the previous one

…As a sort of “guideline”… if this pattern is confirmed,

BITCOIN: We need some more volume…

Finally, BITCOIN has completed the last 5th…and it has been done in a very accelerated way as I wrote yesterday. So high that it all has happened in a matter of 10 minutes. Let me show you the BTC/USD chart in the 5′ timeframe:

That is, a sudden and sharp sell reaching the Target Support (remember I wrote yesterday 3430 USD) follow by a continuous “Flow” of equivalent Buy orders (BOT?) triggering afterwards successive another more “human style” buy orders…

As a consequence, watching now the 1h-chart, the movement upwards has over-passed the previous level which indicates that BTC is probably out

The Good and Bad of Homeowner Associations

There are pros and cons to most everything in life and this includes homeowner associations.
Homeowner Associations (HOAs)
HOAs are a non-profit organization that enforce a community’s covenants and maintain its common areas.
Just like you would have in any other organization there is a board of directors that oversee this function.  The board members are volunteers and are voted in by the members of the community.
Pros and Cons
There is a maintenance fee that comes with the services provided and organized by the HOA.  It is usually in the form of a monthly payment, but some do it quarterly.
Here are some of the

BITCOIN: Equal Patterns = Equal Results?

Another day of tiny volume, drafting what people is starting to call another “Bart” pattern, this time inverted.
Actually, if we want to be more rigorous with the TA and Pattern Recognition nomenclature this is what is called as Bear Flag… again…
Flags or pennants used to indicate a sudden acceleration of the price, it could be upwards or downwards but, since it is placed at then of a long candle down it is more likely that the acceleration would occur by tthe same direction, downwards…
Also, I feel it must be downwards since the EW-count still has some room to add a

The Most Important Formula for Rental Properties

When it comes to investing in rental properties it is important to know the metrics that determine whether your property is likely to be profitable.
The Formula You Need to Know
Below is the simple formula to determine your operating costs which then allows you to figure your net operating income (NOI).
It what I use to make sure I “buy right” as I like to call it:

Knowing which items going into you operating expenses is vital.  The ones in the above formula are mainstays and should always be included.
If a rental property won’t cash flow on paper, then why assume it will

BITCOIN: This is the EW count on play…

I have to make reference here to my post published on January 15th, called “BITCOIN: Current Possibilities”.

There, I planned two scenarios, depending if the 5th wave was already completed or not…

Well, what it seems now is that the previous 4th wave formation has lasted 5 days to complete and what we are seeing right now is the final 5th wave down…as an extended wave.

The target support 1 has been crossed by the price, reaching resistance at the same level of wave (3) and creating a double bottom which is a good sign of recovery but, the (5)th wave down

When a Bullish Market?

…or better said, by when the reversal will be confirmed?

Honestly, I do not know with certainty but I can share with you what I think are really good and simple tools to assess this point:

The Crypto Total Market Cap, in a Daily timeframeThe 200 DMA lineThe “Volume Flow Indicator” by LazyBear

Essentially, the Market is in a Bearish Trend when, the 200 DMA keeps located above “Total Market candle Line” and the “Volume Flow Indicator” [VFI] keeps below the “0” line separating two scenarios.

So, to confirm the reversal trend we should have to see first, an “approach” of the “VFI”
