Today has been a great day for the market. Volume has increased and Bulls seem to come back…but, we have to be careful, this is not done yet! We must wait for the confirmation of the reversal trend and what better than looking how far are we from the “Golden Cross”? And what is a…
Read on Trybe
Tag: trading
How Far We are from the “Golden Cross”?
Today has been a great day for the market. Volume has increased and Bulls seem to come back…but, we have to be careful, this is not done yet! We must wait for the confirmation of the reversal trend and what better than looking how far are we from the “Golden Cross”? And what is a…
Read on Trybe
Trybe TV – Bitcoin Technical Analysis: BREAKOUT IN PRICE AND VOLUME
Bitcoin has broken above the $3,600 resistance, and is now testing $3,800. This breakout was backed by a very bullish increase in volume. Looking at the daily MACD, we’re seeing some slight bearish divergence. This suggests we could see a pull back. Should that happen, I’d watch for support around $3,700-$3,650. The daily chart also…
Read on Trybe
Bitcoin Technical Analysis: BREAKOUT IN PRICE AND VOLUME
Bitcoin has broken above the $3,600 resistance, and is now testing $3,800. This breakout was backed by a very bullish increase in volume.
Looking at the daily MACD, we’re seeing some slight bearish divergence. This suggests we could see a pull back. Should that happen, I’d watch for support around $3,700-$3,650.
The daily chart also shows price breaking above the 50 day MA. If the daily candle closes above the 50 day MA, it’ll be a good indication this latest breakout has legs…at least temporarily.
In today’s video analysis I go a little more in-depth. I discuss market psychology, where price may go
Will The S&P 500 Make All-Time New Highs In 2019??? – Part 2
About one month ago I wrote a post titled,
Will The S&P 500 Make All-Time New Highs In 2019???
Edward Yardeni, who spent decades on Wall Street running investment strategy for firms such as Prudential and Deutsche Bank, predicts stocks will break out to all-time highs this year.
“I’m still sticking with 3100 and feel better about it,” said Yardeni, who noted valuation multiples, low interest rates and inflation is setting Wall Street up for a very good year.
In order for Ed to be right, price has to get pass the daily supply zones in white and
Crypto Contest February 18: Lunyr
Lunyr (Bittrex: LUNBTC) has broken out of the triangle pattern in the weekly chart.
(Chart courtesy of Tradingview.com (log scale))
Elliott Wave Analysis
In Elliott Wave terms, Lunyr began a wave one advance in December 2017. The red wave one (blue sub-waves i-ii-iii-iv-v) finished in January 2018, and the red wave two (blue sub-waves a-b-c) correction ended in September 2018. If this wave count is correct, Lunyr should be heading next towards the January 2018 peak in the red wave three.
(Chart courtesy of Tradingview.com (log scale))
Funnymentals
Lunyr is an Ethereum-based decentralized crowdsourced encyclopedia which rewards users with app tokens for peer-reviewing and contributing information.
My TIMM Trading Pit Commentary – Wk Of 2/11/19
TIMM (Traders’ & Investors’ Mentor Market) provides the tools analysts need to share their insights in a central location, TIMM becomes a market where traders and investors can shop for the insights they’re looking for.The Trading Pits are, in some ways, the main meeting place for TIMM. Here you will see folks sharing insights and asking questions about markets.
Commentary from this past week includes:
Gold just hit a 4 hr supply zone, if the trade is going to work, will need help from the US dollar, meaning it must get stronger.
I don’t trade copper, but here was a nice set-up
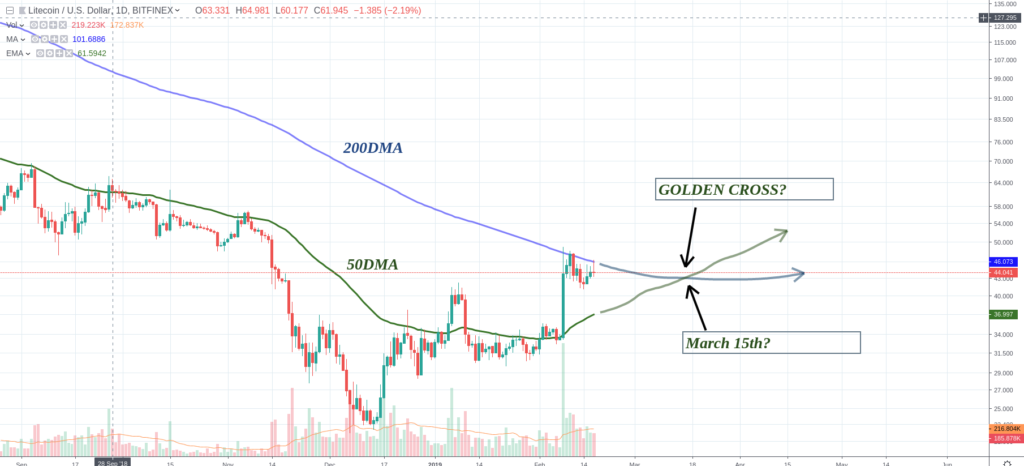
LITECOIN: How far from the “Golden Cross”
For those who do not know, the “The Golden Cross” is a Candle-stick pattern which indicates a long-term Bull Market going forward. It occurs when a short-term moving average crosses over a major long-term moving average to the upside and it is very used by investors, analyst and traders as an indication of a major…
Read on Trybe
LITECOIN: How far from the “Golden Cross”
For those who do not know, the “The Golden Cross” is a Candle-stick pattern which indicates a long-term Bull Market going forward. It occurs when a short-term moving average crosses over a major long-term moving average to the upside and it is very used by investors, analyst and traders as an indication of a major…
Read on Trybe
LITECOIN: How far from the “Golden Cross”
For those who do not know, the “The Golden Cross” is a Candle-stick pattern which indicates a long-term Bull Market going forward.
It occurs when a short-term moving average crosses over a major long-term moving average to the upside and it is very used by investors, analyst and traders as an indication of a major upward turn in a market.
Normally, the two moving averages used are the 50-Day MA and the 200-Day MA.
When the 50 DMA crosses the 200 DMA to the upside this is called GOLDEN CROSS…. Worth to say that also the contrary would indicate that the Bear Market is