Is China A Buying Opportunity Or Value Trap???

On Monday, China announced that the Chinese economy grew 6.6 percent in 2018, which was the slowest pace since 1990. Also, Chinese President Xi Jinping said the country needed to be on guard for “black swan” events, while also preventing “grey rhino” events.

A black swan event is an unforeseen occurrence that has dire consequences whereas a grey rhino is an obvious threat that is ignored.

“The grey rhino is very clear, it’s the high level of debt in the whole economy from the government, the local government, and to the privately-owned enterprises 

On Tuesday, IMF Managing Director Christine Lagarde said the IMF cut

Crypto Contest January 25: TransferCoin

TransferCoin (Bittrex: TXBTC) has broken out of the triangle pattern in the weekly chart.

(Chart courtesy of Tradingview.com (log scale))
Elliott Wave Analysis
In Elliott Wave terms, TransferCoin began a wave one advance in September  2015. The red wave one (blue sub-waves i-ii-iii-iv-v) finished in October 2017, and the red wave two (blue sub-waves a-b-c) correction ended in November 2018. If this wave count is correct, TransferCoin should be heading next towards the October 2017 peak in the red wave three.

(Chart courtesy of Tradingview.com (log scale))
Funnymentals
TransferCoin is a cryptocurrency with masternodes. You can view the masternode stats below.

(Sources: TransferCoin and MasterNodes)

If you think this analysis

Qualcomm…Left Out Of The Rally

Xilinix, Teradyne, Lam Research and Texas Instruments all beat earnings expectations in their reports on Wednesday, sending the chip sector higher by the end of the day.  The only outlier was Qualcomm which was negative on the day.

Kerrisdale Capital, is shorting Qualcomm shares and released a research report stating that Qualcomm is “teetering on the brink of disaster” and that its unique business model is “living on borrowed time.”

The FTC sued Qualcomm for violated FRAND {fair, reasonable, and non-discriminatory} rules, which states that companies that become members of the rule structure must license their products to competitors.

Apple filed a lawsuit

Forex $1 MM Challenge – Trade #5 (1-23-19) Sold AUDUSD

This was a trade set-up I took after posting about the Aussie going lower two days ago.

Currency Analysis Report 1-22-19…Aussie Set To Go Lower

China is Australia’s largest trading partner in terms of both imports and exports and as a result, Australia is more affected by China’s economy than most countries. As China goes, the Australia currency, the Aussie goes.

Daily Chart (Entry Time Frame) – although not the best zone, one set-up was already missed when price entered and left the daily supply at this time there is no trade set-up.

So wait for a pull back to the

Crypto Contest January 24: Decentraland

Decentraland (Bittrex: MANABTC) has broken out of the triangle pattern in the daily chart.

(Chart courtesy of Tradingview.com (log scale))
Elliott Wave Analysis
In Elliott Wave terms, Decentraland began a wave one advance on September 12, 2018. The red wave one (blue sub-waves i-ii-iii-iv-v) finished on December 3, 2018, and the red wave two (blue sub-waves a-b-c) correction ended on January 13 this year. If this wave count is correct, Decentraland should be heading next towards the December 3, 2018 peak in the red wave three.

(Chart courtesy of Tradingview.com (log scale))
Looking at the weekly chart, I believe Decentraland is currently in the red wave three (blue sub-wave

Steem Price Action – Bearish U-Turn Already? Volume Says Otherwise

Just a day ago I wrote about the price of steem working on a longer term bottoming formation.  However, within that you will have your moves up and down and one of those moves could even bust up the formation all together.
So let’s take a look at the reversal pattern we got due to yesterday’s candle close.

 Bearish U-Turn
I talked about the bullish u-turn pattern alot during the bull market, but right now we are discussing a bearish u-turn.
The gist of it is after two or more up days in a row the next candle trades above the previous day’s high

Unusual Options Activity In JetBlue Airways

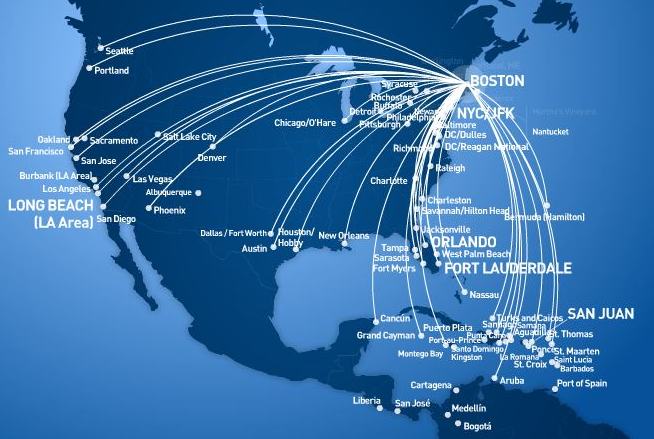
JetBlue Airways Corporation, a passenger carrier company based in New York, with 101 destinations in 30 states in the United States, the District of Columbia, the Commonwealth of Puerto Rico, the U.S. Virgin Islands, and 21 countries in the Caribbean and Latin America.

JetBlue Airways
Corporation (JBLU) is scheduled to report fourth-quarter 2018 earnings results
on in the morning before market opens. Analysts expect the company to report
earnings of $0.40 per share, a 25% growth year-over-year. Revenue is expected
to grow 11% year-over-year to $1.96 billion.

In the third quarter, earnings topped estimates, revenues was in line with estimates, but higher costs weighed on

STEEM: Crossing 200 DMA?

After more than a week of amazing performance, STEEM has reached the level of the 200 DMA at the STEEM/BTC pair.

Typically, crossing that line would indicate a very good signal of reversal trend.

We have to be very attentive right now.

If STEEM manages to break that 200 DMA, it would be very likely that a higher price will be reached…

Taking into account as well all the positiveness I have now (LoL), I would consider as well the following CUP & HANDLE Pattern another good signal which corroborates the previous one

…As a sort of “guideline”… if this pattern is confirmed,

Will The S&P 500 Make All-Time New Highs In 2019???

Contrarian investing is an investment style in which investors go against prevailing market trends by selling when the crowd is are buying and vice versa. A contrarian investor believes that certain crowd behavior among investors can lead to exploitable mis-pricings in the markets.

The bull/bear ratio indicates overall investor sentiment in the market by comparing the number of bullish and bearish investors. The ratio is a contrarian indicator in that a bull/bear ratio > 1 indicates conditions are too bullish and you should take a bearish stance and a bull/bear ratio less < 1 indicates conditions are too bearish and you

Crypto Contest January 23: Propy

Propy (Bittrex: PROUSD) has broken out of the triangle pattern in the daily chart.

(Chart courtesy of Tradingview.com (log scale))
Elliott Wave Analysis
In Elliott Wave terms, Propy began a wave one advance on December 17, 2018. The red wave one (blue sub-waves i-ii-iii-iv-v) finished on December 26, 2018, and the red wave two (blue sub-waves a-b-c) correction ended on January 14. If this wave count is correct, Propy should be heading next towards the December 26, 2018 peak in the red wave three.

(Chart courtesy of Tradingview.com (log scale))
Funnymentals
Propy is a global real estate marketplace with decentralized title registry. Crypto Finder interviewed the CEO