Unusual Options Activity In Alibaba

At the World Economic Forum in Davos, Switzerland this week, Alibaba CEO Daniel Zhang told delegates that China is a “self-sufficient market,” and seemed to downplay the effect of the trade conflict on consumption in China: “China has a lot of opportunities. Trade war is only one matter,” Zhang said.

On Friday, MKM Partners’ Rob Sanderson raised its price target for the Chinese commerce giant to $245, writing that Alibaba’s stock is capable of weathering the macroeconomic concerns that dragged down shares last year, citing opportunities in its Alibaba’s cloud division, a moderate spending outlook and other positive factors.

Source

Alibaba’s

Crypto Contest January 28: Dent

Dent (Binance: DENTETH) has broken out of the triangle pattern in the daily chart.

(Chart courtesy of Tradingview.com (log scale))
Elliott Wave Analysis
In Elliott Wave terms, Dent began a wave one advance on August 6, 2018. The red wave one (blue sub-waves i-ii-iii-iv-v) finished on October 30, 2018, and the red wave two (blue sub-waves a-b-c) correction ended on January 2 this year. If this wave count is correct, Dent should be heading next towards the October 30, 2018 peak in the red wave three.

(Chart courtesy of Tradingview.com (log scale))
Funnymentals
Dent is tokenizing the mobile data industry and creating a world-wide marketplace to

BTC 29 Jan – still on track

This is a short update to explain the price movements of today in terms of yesterday’s prediction.

In the post “BTC update” yesterday I explained that BTC was both in a channel (forming a bull flag) and a converging triangle (signalling a breakout) as shown below:

From https://mentormarket.io/bitbrain/btc-update/

The triangle has now broken out – with some noteworthy results.

Made by Bit Brain with TradingView

The triangle broke downwards:This was obviously not the positive breakout from the channel as I had hoped it might be.The price dip to a new 2019 low of approx $3380 did not break through the bottom of the channel: The channel remains intact and that the bull flag scenario is still in play.While still remaining in the channel, the probability that

3 Reasons I Remain Long-term Bullish on Bitcoin

This marks the inaugural post of the ‘Three Reasons’ series. The posts will alternate – a bullish outlook for a particular blockchain project followed by a bearish. Three is an estimate of convenience only.  These posts are intended to be brief expressions of my opinion on particular cryptocurrencies and are not exhaustive in detail.
3 Reasons I Remain Long-term Bullish on BTC
The 2020 Halvening
In May 2020 the block reward for BTC will go from 12.5 BTC per block to 6.25 effectively halving the rate of inflation and new coin supply. In the months before and after this drop in supply creation, it is

Steem Price: That Bearish U-Turn Came to Fruition

A few days back I mentioned how the price of steem formed a bearish u-turn pattern on the daily chart after testing that 40 cent area.
The volume was weak on it so I thought, maybe it won’t play out.
Unfortunately the Bear Roared

The gold circle from my original chart points out the bearish u-turn pattern marked by the reversal candle (first red candle of the past six red days) and the pattern has played out with the following sell off.
Possible downside targets are the 25 cent level that acted as a bottom on the past two little pull backs.
Conclusion
What this basically

Steem Price: That Bearish U-Turn Came to Fruition

A few days back I mentioned how the price of steem formed a bearish u-turn pattern on the daily chart after testing that 40 cent area.
The volume was weak on it so I thought, maybe it won’t play out.
Unfortunately the Bear Roared

The gold circle from my original chart points out the bearish u-turn pattern marked by the reversal candle (first red candle of the past six red days) and the pattern has played out with the following sell off.
Possible downside targets are the 25 cent level that acted as a bottom on the past two little pull backs.
Conclusion
What this basically

Forex Analysis Report 1-27-19…Will The USD/CAD Continue To Rise??? – Part 3

Several weeks ago, I talked about a trade set-up where I was looking to short the USD/CAD, but it never pulled back.

So, I identified another trade set-up on the 60 min time frame with the opportunity to jump on the short which I talked about in that same post.

Forex Analysis Report 1-10-19…Will The USD/CAD Continue To Rise??? – Part 2h

The USD/CAD broke below the 1.33 handle was went down more than 100 pips on Friday during the US forex session.

U.S. dollar went down ahead of this week’s FOMC meeting because the expectation is that the Feds aren’t going

BITCOIN: another possibility…

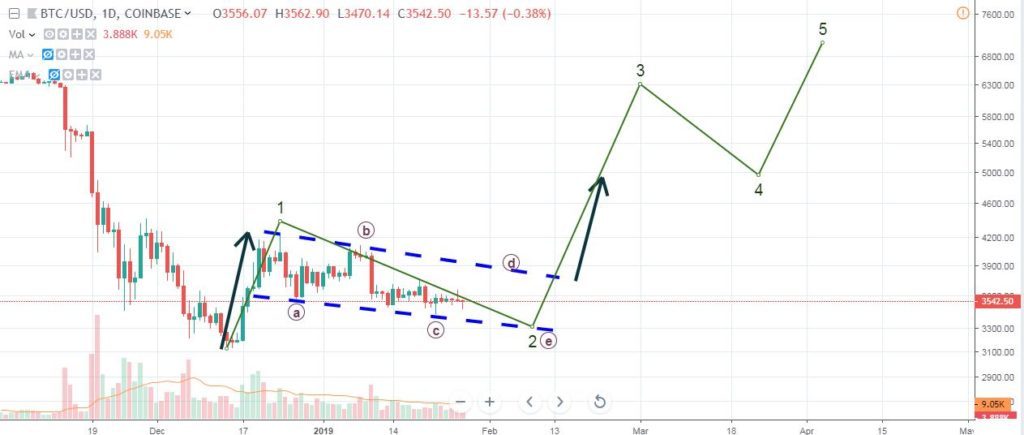
With such a tiny volume is being really difficult to find any indication that show us the next move of BITCOIN and so, the direction of the Market.
The positive view now is that BITCOIN is still within the correction of a first wave within an upwards cycle…hopefully.
BITCOIN may be forming just a long Bull-flag, ending the wave 2 as I show you below:

Breakage of this Bull-flag upwards could be on (d) or after rebounding on (e)…
The upper Dashed line is marking the limit… we have to pay attention to that line because it is very likely that BTC has already

BITCOIN: another possibility…

With such a tiny volume is being really difficult to find any indication that show us the next move of BITCOIN and so, the direction of the Market.

The positive view now is that BITCOIN is still within the correction of a first wave within an upwards cycle…hopefully.

BITCOIN may be forming just a long Bull-flag, ending the wave 2 as I show you below:

Breakage of this Bull-flag upwards could be on (d) or after rebounding on (e)…

The upper Dashed line is marking the limit… we have to pay attention to that line because it is very likely that BTC has already

BTC update

This post is based on my last BTC post of 24 Jan

In that post I discarded my previous converging triangle and proposed that BTC was forming a bull flag.

Looking at the recent developments of the last week, I have a modification to that theory:

BTC once again appears to be forming a converging triangle. It has not yet broken out of the channel I described in my previous post and is thus still forming the bull flag. Shown below is the chart I used in my previous post:

From https://mentormarket.io/bitbrain/btc-24-jan-a-change-of-direction/

BTC remains range bound, so the bull flag remains in play for now.