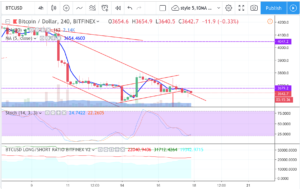
Still on sideway move since 1 week ago, seem like it’s low from 3680 tiny candles consolidation to now around 3650 zone. Already past triangle apex point but neither side is giving way. Lower highs on 4hr chart, on hourly chart, lower highs and lower lows mini down channel.
News: (Current) | (Upcoming)
Short term moving average (day candle) :
RSI :
Network Value to Transactions Ratio :123
Total marketcap :121
Dominance :52.4
Bitfinex Margin Long/Short Volume Ratio :
Depth Chart : (S) | (R)
Weekly Timeframe :
Tag: Cryptocurrencies
Crypto Contest January 17: Augur
Augur (Bittrex: REPUSD) has broken out of the triangle pattern in the weekly chart.
(Chart courtesy of Tradingview.com (log scale))
Elliott Wave Analysis
In Elliott Wave terms, Augur began a wave one advance in December 2016. The red wave one (blue sub-waves i-ii-iii-iv-v) finished in January 2018, and the red wave two (blue sub-waves a-b-c) correction ended in December 2018. If this wave count is correct, Augur should be heading next towards the January 2018 peak in the red wave three.
(Chart courtesy of Tradingview.com (log scale))
Funnymentals
Augur is a decentralized oracle and peer to peer protocol for prediction markets. Veil, a peer-to-peer trading platform built on Augur,
Two Minute Crypto – Retail Investors Part 1
Please click the link to listen to the 18th episode of my weekly crypto podcast ‘Two Minute Crypto.’ These are intended to be short, single-topic ramblings on some aspect of the cryptosphere. Comments and critiques welcome.
Transcript
Two Minute Crypto – Retail Crypto Investors
Welcome to Two Minute Crypto – today sees the beginning of a two-part series focusing on retail crypto investors. In this episode, I’d like to focus on a few reality checks that are absolutely essential to a retail crypto investor’s success. For simplicity, by retail investor, I mean someone who places capital in the crypto market with a minimum of
BITCOIN: Current Possibilities
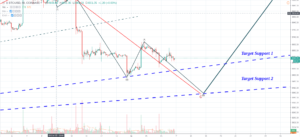
Two Target supports, two different alternatives…
Assumption: Extended 5th still on going
Last 5th wave of the down-cycle may be composed by 5 subwaves (Brown). First wave (very long IMO) and 2nd wave completed… 3rd wave on going…
Target limit 3375 USD (Target support 2)
Assumption: 5th wave completed
1st wave (brown) up completed, building the 2nd… If BTC rebounds on the “Target support 1” around 3537 USD then the EW count is valid and the 3rd wave upwards will be formed…
Entry Target: 3540 after rebounding on the support 1.
@toofasteddie
*Disclaimer: This is just my personal point of view, please, do your own assessment and act consequently. Neither this
BITCOIN – symmetrical triangle apex soon
Indeed it did sell off then bounce again now consolidating into a possible mini symmetrical triangle. Possible up channel too. as the fake spike out just now almost tested the channel top and my short got liquidated then it went down again. Bulls bears fighting at 3680 zone for grounds back into symmetrical triangle on 4hr closing in on apex soon in next few candle for the next direction move. bias down side
News: (Current) | (Upcoming)
Short term moving average (day candle) :
RSI :
Network Value to Transactions Ratio :123
Total marketcap :122
Dominance :52.4
Bitfinex Margin Long/Short Volume Ratio :
Depth Chart : (S) |
Ethereum Hardfork Delayed
The Ethereum network is scheduled for a hard fork called Constantinople today. But unlike the hard fork on Bitcoin Cash in recent months, this hard fork is expected to not cause any issues as all transaction validators are likely to upgrade their software which will be a plus for the Ethereum community.
The upgrade is intended to reduce mining rewards from three to two, speed up processing times, improve the way the network monetizes data storage and address crypto scalability — the ability to process transactions efficiently and quickly. Thus, this hard fork is likely to be positive for the valuation
Fiat pairs trading on Binance!
A brand new Binance exchange named Binance Jersey is up and running!
It offers fiat trading with the pairs BTC EUR, BTC/GBP, ETH/EUR and ETH/GBP.
From https://www.binance.je/en/trade/BTC_GBP
The exchange launched only a few hours ago and is a big step forward; both for Binance which is looking to release its own DEX soon and for cryptocurrency mass adoption in Europe.
Binance Jersey is located at https://www.binance.je – you can’t access it through the regular Binance site. Binance Jersey is located on self-governing British Isle of Jersey – hence the name. This means that you have to make a new account, which is fairly painless,
Crypto Contest January 16: NoLimitCoin
NoLimitCoin (Bittrex: NLC2BTC) has broken out of the triangle pattern in the daily chart.
(Chart courtesy of Tradingview.com (log scale))
Elliott Wave Analysis
In Elliott Wave terms, NoLimitCoin began a wave one advance on November 23, 2018. The red wave one finished on December 3, 2018, and the red wave two correction ended on December 7, 2018. The red wave three (blue sub-waves i-ii-iii-iv-v) advance finished on December 27, 2018, and the red wave four (blue sub-waves a-b-c) correction ended on January 13 this year. If this wave count is correct, NoLimitCoin should be heading next towards the December 27, 2018 peak in the red wave five.
(Chart
BITCOIN: Two possibilities, same result…
As explained yesterday… currently there are a lot of chances that the end of the correction has not been reached, and so, there may be a last move downwards in order to terminate the 5th wave down.
BITCOIN is now approaching the first target support on which I would expect some hesitance but, in order to complete the 5th wave down, I think there is a high likelihood of reaching a lower price than the one reached by the 3rd wave.
Using FIBONACCI Levels, right now BTC is touching the 61.8% of total retracement but, as you can see, does not seem
BTC medium-term – 15 Jan
A look at the medium-term future of BTC as I see it.
BTC is forming another converging triangle, making a breakout a strong possibility from next week.
The lower side of the triangle seems to have been defined. This is not a certainty at this stage – it’s not impossible that a near-future price drop redefines the triangle. I would say that there is about a 65% probability that the triangle is now in it’s final form and will not have to be redefined.
A trendline which started on 6 December continues to be my benchmark for current price movements.
The typical Breakout Zone