ETH technical analysis

ETH seen from the temporality of 1W we can observe how the previous candle has closed below the 259 support, the current candle is testing the horizontal now covered in resistance, I have indicated a support in the 196 because if the candle does not succeed in claiming the support, it is very possible that the price will fall towards that point to find bullish impulse again and pass the resistance without any problem.

ETH seen from the temporality of 1D we can observe more closely what is happening in the current candle structure, the previous candle managed to close above

The Price of Steem is Being a Tease

So here we are again at this price level that has become a sticking point for some time.  We will see something new or more of the same?
Pendulum of Price

Looking at the daily chart of steem we see that this 40 cent area has been are line in the sand.  Price closed above 40 cents a couple days ago and currently remains above it.
The real question is can we form some kind of base here to see possible price appreciation into the 50s.
Back in April it looked like price was firmly established above 40 cents and our upside wad near

The Future of Privacy Coins

This article was inspired by the Cointelegraph which article I read yesterday titled: “Is Bitcoin’s Increasing Anonymity a Threat to Privacy Coins?”. My post today is not written as a response to it, nor is it an attempt to debunk it. I disagree with the author a little, but I still think that he wrote a good article. It made me think for myself – which is exactly what good articles should do.

The article generally takes a dim view of the future of privacy coins. My opinion is the opposite of that. Let me tell you why, and then you can

Crypto Contest June 13: Universa

Universa (Bitfinex: UTNUSD) has broken out of the triangle pattern in the daily chart.

(Chart courtesy of Tradingview.com (log scale))

Elliott Wave Analysis

In Elliott Wave terms, Universa began a wave one advance on December 14, 2018. The red wave one (blue sub-waves i-ii-iii-iv-v) finished on January 5, 2019, and the red wave two (blue sub-waves a-b-c) correction ended on May 30. If this wave count is correct, Universa should be heading next towards the January 5 peak in the red wave three.

(Chart courtesy of Tradingview.com (log scale))

Funnymentals

Universa blockchain platform is the first Russian blockchain platform for building business applications intended to address the tasks

Analyzing EOS, BNB, BAT, ETH, LTC and XRP: A Closer Look

Like Bitcoin, many altcoins are looking ripe for a larger move.

EOS is peeking it’s head up and out of a wedge it’s been consolidating in these past few days.

Binance Coin (BNB) just broke out of the bullish, descending broadening wedge we discussed 2 days ago.

Basic Attention Token (BAT) is consolidating below heavy resistance and on top of an ascending line of support. It looks poised to breakout in the next few days.

Litecoin has been one of the most impressive coins of 2019. Last we spoke, it was finding resistance at $125. It has since broke resistance and, as discussed in

EOS is Pausing before the Run to $20+

EOS has had an amazing start into the first half of 2019 and I am expecting this to full fledge continue. I have been calling this from the beginning of the year in the $2 and we are going back to highs. I am watching the $6 level here and I WANT this to hold. That does not mean it has to but if it does it means we likely reach targets quicker.

We may pullback into the Mid 5’s but I do not see us going lower than this. I am looking for EOS to catch up to litecoin

BITCOIN – 12 Jun

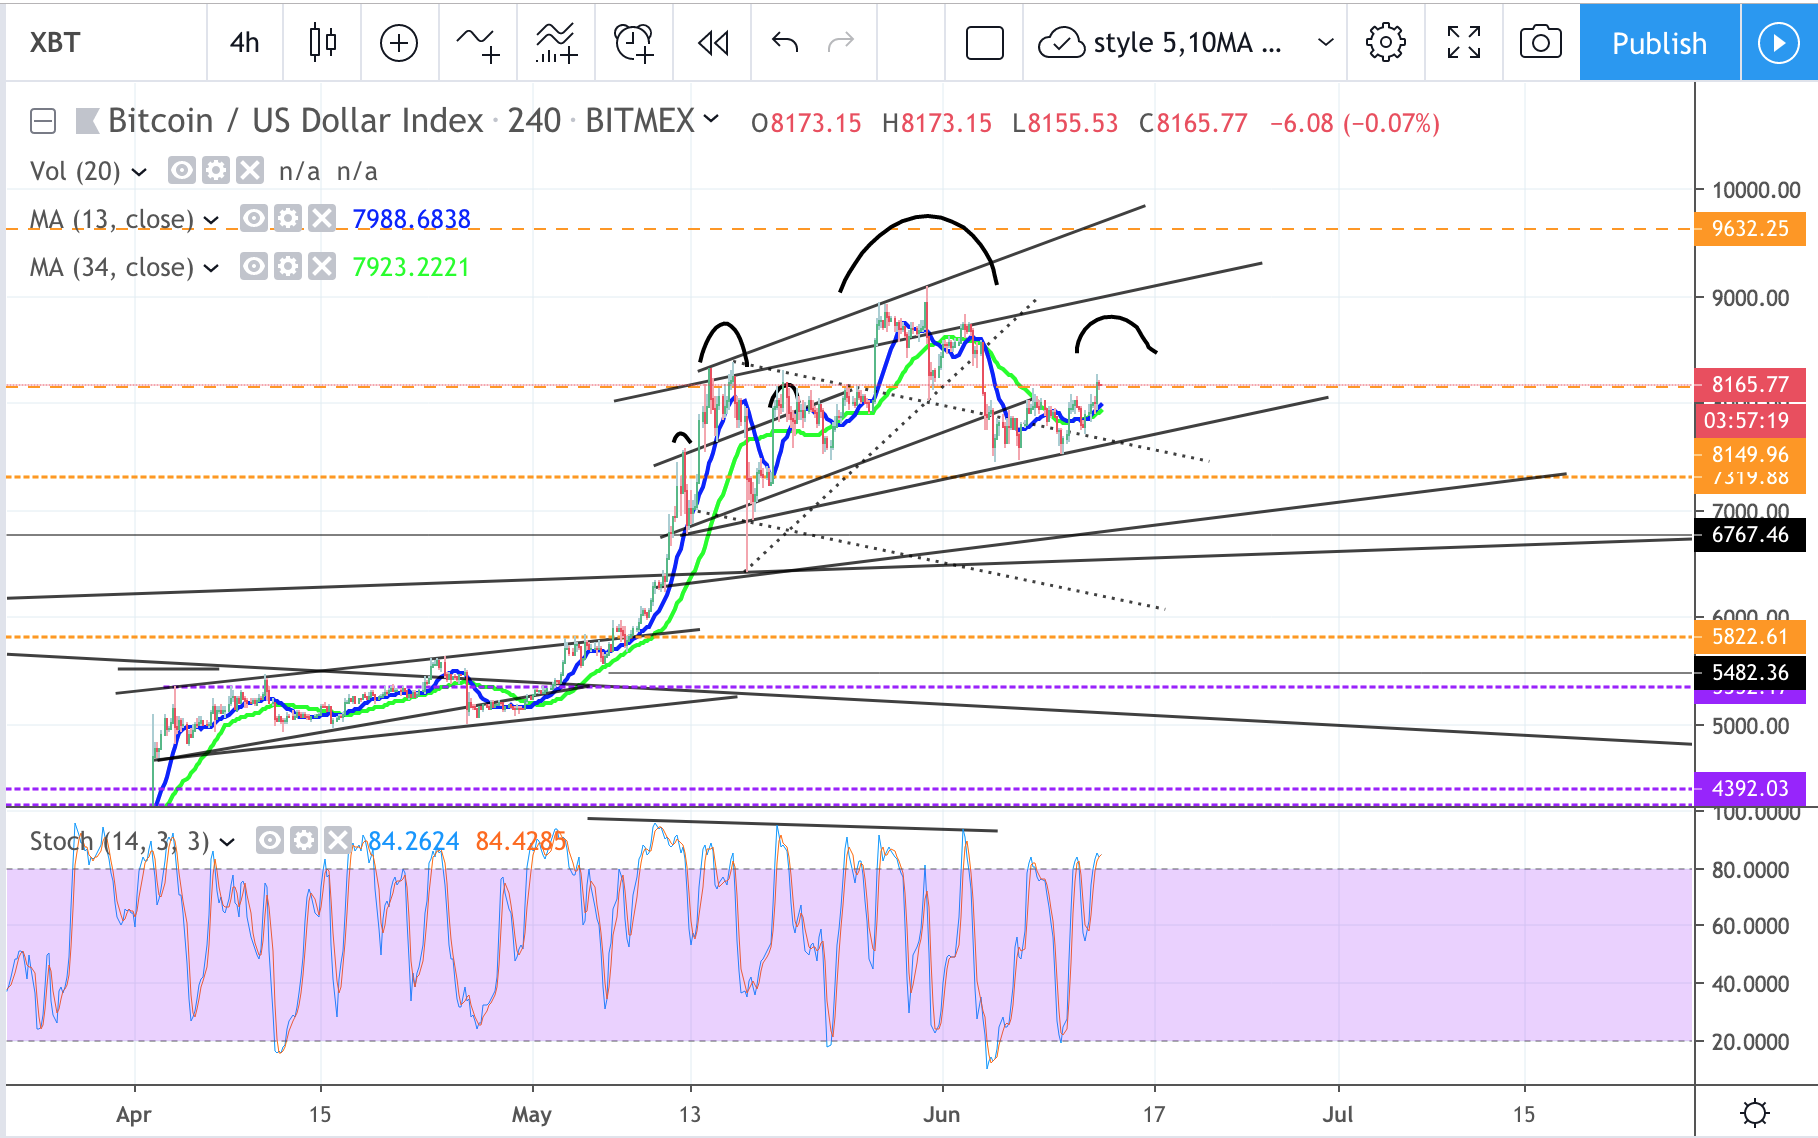
On 4hr chart, hitting resistance level around 8200 zone. Possible ascending triangle in making on the daily chart.
News: (Current) | (Upcoming)
Short term moving average (day candle) :
RSI :
Network Value to Transactions Ratio :
Total marketcap :
Dominance :
Bitfinex Margin Long/Short Volume Ratio :
Depth Chart : (S) | (R)
Weekly Timeframe :

LOOM technical analysis

LOOM seen from the temporality of 1D we can see how the bulls are trying to push the price above the low range of the accumulation structure to claim the support, we see how the current movement of the candles maintain an upward momentum, the low range is located at 1135, I have drawn on the chart the possible trajectory that could follow the price in the support claim, to get it and test it as support we should see the price reach without problems our first take profit located in 1881.

LOOM seen from the temporality of 1W we can

Bitcoin Creates New Local High…Bull Trap or Bull Run?

Bitcoin took out the prior local high, rising to nearly $8,300 before bears stepped in to push it back down. It’s currently trading within a major area of resistance between $8,250 and $8,150. Until we see a 4 hour candle open and close above this resistance, be aware of a possible bull trap. That said, price did break out on a decent amount of volume. The fact it hasn’t been strongly rejected is significant. Should we see a 4 hour candle open and close above $8,150, I’d have to favor the bulls with another move up testing $8,450.

Price is now

BTC and more – 12 April

 
I have publicly stated that I expect BTC to drop in price soon, based mainly on an extended period of reduced volume. Perhaps BTC didn’t hear me, because so far it appears to be ignoring my prediction.
Contrary to the medium-term decline in volume, BTC has undergone a short-term volume increase and has now formed a potentially bullish converging triangle pattern. It’s a short-term pattern, so I wouldn’t read too much into it and it doesn’t invalidate any predictions of a medium-term drop, but it does indicate that BTC’s next movement is probably a bullish one.
If BTC does rise a few