BITCOIN: not only volume is increasing…

Everyone must be aware about the impressive level of Exchange volume that BITCOIN and the whole Crypto market is maintaining nowadays. BITCOIN is clearly approaching to similar values as the ones played in All time highs, by the end of 2017.

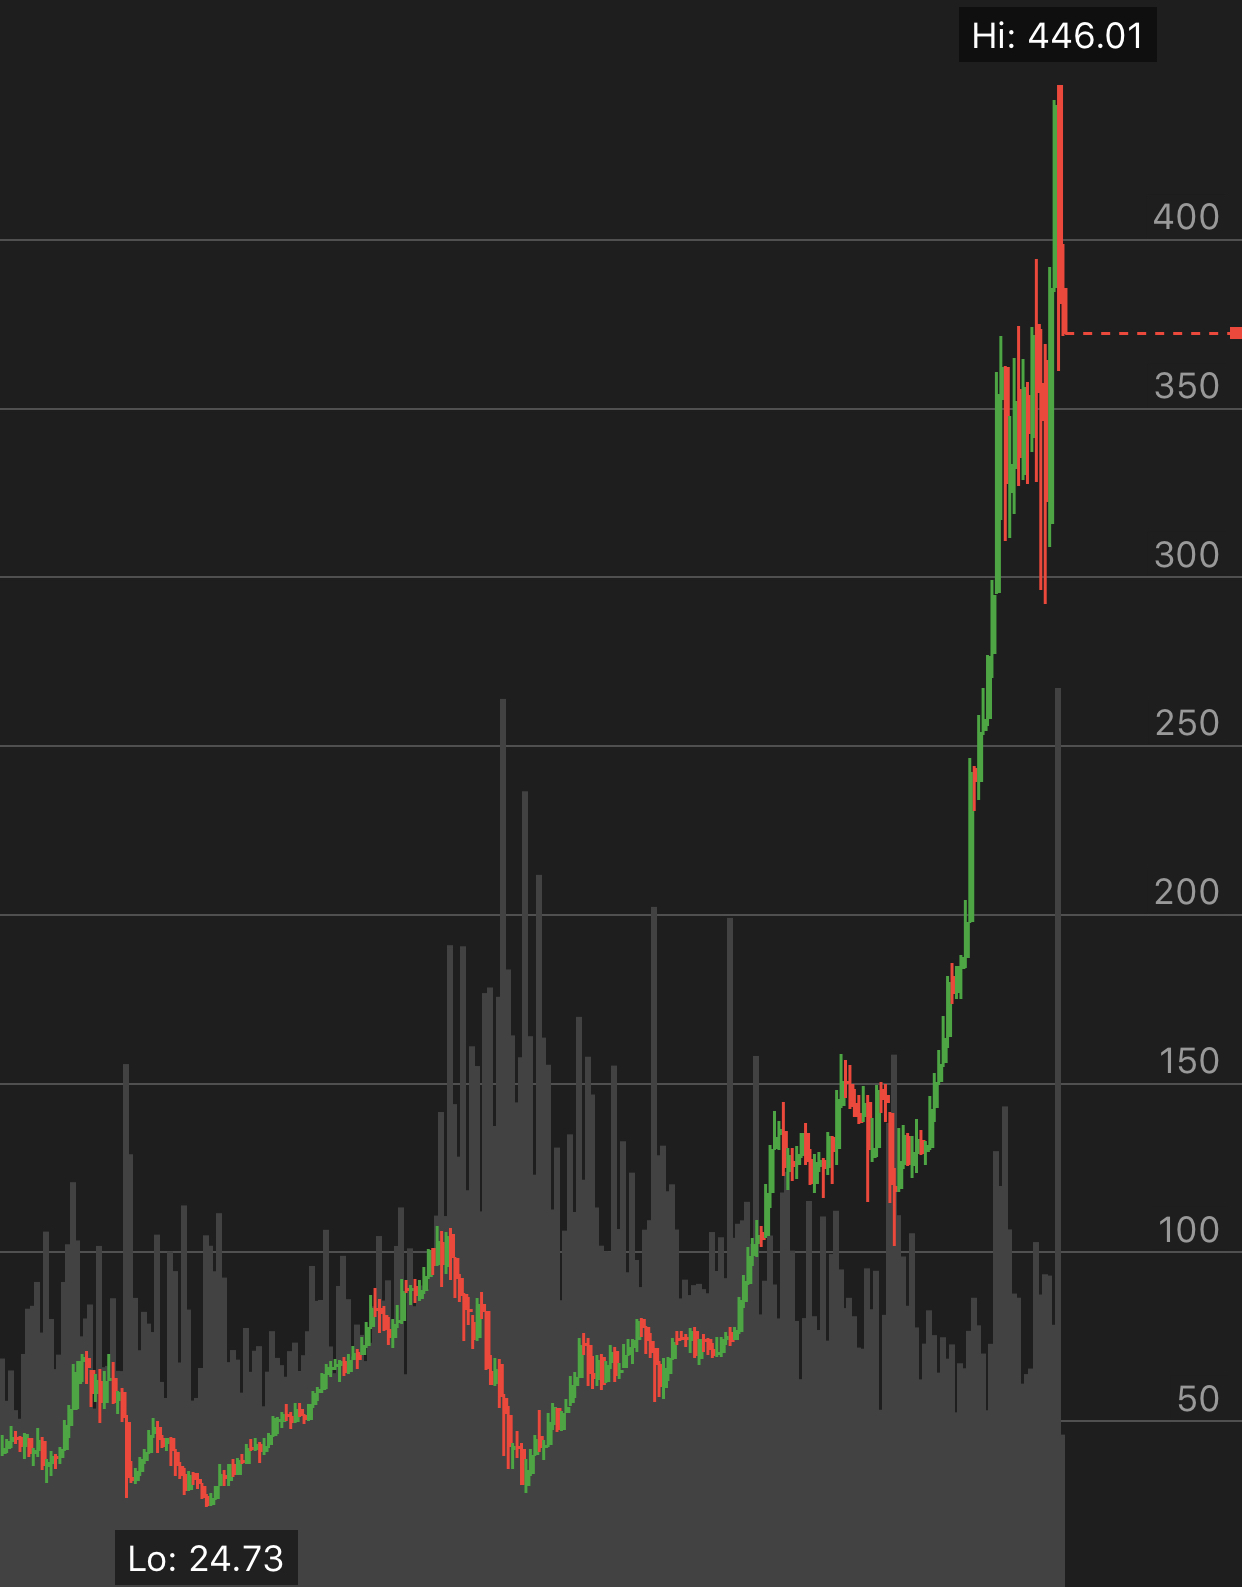
This is for sure a good sign on the recovery of the market but, besides the green values on price and volume, there is also the increase of number of transactions experimented by BITCOIN Blockchain:

Previous, chart, provided by coinmetrics.io, shows that BITCOIN Blockchain is being used more intensively nowadays.

Additionally, we have a clear increase regarding BITCOIN interest on Google

Boeing’s Market Cap is Crashing $BA

I wrote a few weeks ago when the BA news came out about their 737 Maxes having trouble that the chart look gross. Not only did it look like a parabolic momentum top, it likely has a lot of people trapped from the last few years. Her is a clear line in the sand for the BA lovers and K believe it will be tested very soon.

You can see the parabolic “bitcoin like” rise that BA has experienced over the past years. If you zoom in you will notice the consolidation, breakup, and failed breakout on the chart.

Giving this

BITCOIN: “Don’t say “wheat” until it is in the bag and well tied”

…or as we say in Catalan Language: “no diguis blat fins que no sigui tot al sac i ben lligat” which means that despite the extraordinary rise of BITCOIN today, which as I wrote yesterday as a first option to happen in this post , we still cannot say the reversal is confirmed yet.

This is the chart I presented as an option 1 yesterday:

And this is how it looks today:

That long daily candle has crossed the 200
DMA and almost has reached the 1.618 FIBO level of the fist wave for the
end of the 2nd wave, which it is

Auto Draft

While watching the situation of the Crypto Market, from time to time is good to deviate the focus of observation from the crypto King (BITCOIN), despite I still agree with the fact that the whole market is affected somehow by the steps of Satoshi’s creature.

That’s why, in order to get a better view, I used to check the evolution of the Total Crypto Market cap.

Below you can see the Weekly Chart, which is very similar to the BITCOIN’s chart but with some differences:

In this chart you can notice how, after having passed a long recession and having touched the Ground

BITCOIN: the “umpteenth” tentative…

I have the suspicious that after almost 1 month of a very
boring market BITCOIN is very close to what I call “Decision” point.
This is the point on which Bulls and Bears measures their strengths and
define which way to take next.

On the Daily Chart:

BTC is still far from the “Golden Crossing”
on which both Daily Moving Average lines (50 and 200) would meet. The
extrapolated lines project April 28th as a more likely date for that to
happen…

We have seen a series of Higher Highs which is a
good sign of recovery but what we really need

The Bull run will be driven more by the altcoins…

…than by BITCOIN side…

People may think that is an
obvious aspect since nowadays everybody is aware how major altcoins as
LITECOIN or BINANCE have been performed lately…

But I
remember that I envisage this behavior some weeks ago already and seems
that they are accomplishing the prevision to the perfection…

However, why am I saying that ALTCOINS will lead the Crypto Bull more than BITCOIN?

What it happened in the past was essentially the contrary. BITCOIN lead the grow and after consolidating its growth acceleration there was a huge transfer from BTC to the ALTCOINS.

But this time seems to be
different, altcoins

Did the Big Boys need a Dip? $BA $DOW

Whenever there is panic it is very hard to push out the noise. There is one thing that you should learn to control, and that is your emotions. With the unfortunate Ehtiopian Plane crash over the weekend, the markets came in and saw the entire airline industry gapping down, BIG. $BA gapped down over FIFTY Points! (12%) I am sure MANY average joes and possibly long term holders from very low levels sold at the open. Then what happened?…

That one day crash was bought, MASSIVELY. You got a gap down that trended up all day, and in the beginning I

STEEM: Impressive 24h VOLUME

This level of 24h Volume is really impressive. We have passed from 2 Million $ 9.6 Million $ in a few hours!, currently reaching again the 41th position at the total Market Cap.

Someone is buying and in a consistent manner. It does not look as a couple of big orders being processed…

All Exchanges presenting a very consistent STEEM price, no appreciable pumps in anyone, being the Korean Exchanges a Upbit and Bithumb together with Binance the leaders managing the volume flow today.

Now, it would be a very good signal to break the 0.45 USD upper Resistance and not marking a

The “Golden Cross” Quest: LTC, BNB and EOS

Some days ago I talked about that LITECOIN and BINANCE COIN were presenting an accelerated approach to what is called “GOLDEN CROSS” milestone. You can read my assessment on those Cryptos here and here .

Now I would like you to attract your attention as well on EOS.

As it occurring with LTC and BNB, EOS is setting up a bullish approach to the Intersection between the 200 Day Moving Average and the 50 Day Moving Average.

EOS price has already crossed the 200 Day Moving Average 10 days ago, which is a very good signal, and I suspect we are going to

Accumulation Phase

Last BITCOIN rise may have confirmed, IMO, the entry in the Accumulation Phase. This period of time may take weeks or months and it is characterized by a movement between range of price which can be clearly identified in the Daily Chart.

For instance, on 2015, BITCOIN defined the Key levels as follows:

Upper Resistance Level were tested at least three times during this period while the Bottom Support was tested twice, forming a double bottom, W-Pattern which is a bullish pattern. There was as well an intermediate support on which BTC rebounded a few time too.

On 2015, the accumulation phase