as it was already recognized by @ellipowell on this amazing Steemit INC Financial Update , Steemit INC has been obliged to execute a monthly programmatic sell in order to cope with their costs while implementing powerful upgrades which are starting to bring high cuts on the expenses and good revenues coming from the ads.
She is talking about Monthly programmatic sells but in reality, they used to deposit hundreds of thousands of Steem in a weekly basis.
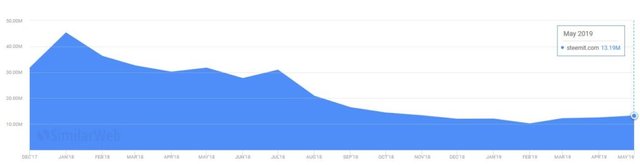
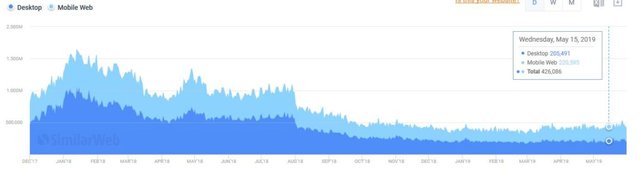
They still power down the same amount of steem, which is around 326000 steem a week but lately I have noticed that the amount withdrawn mainly to BINANCE and HUOBI exchanges is decreasing continuously as you can see in the picture below:
@gsr-io is one of the accounts used by @steemit in order to withdraw Steem to the exchanges.
I am curious to see @penguinpablo weekly post regarding the total amount of Liquid STeem stored at the exchanges… I think we should start to note an inflexion on the trend, hopefully starting to create some scarcity that would help the price of STEEM to get recovered earlier.
I would like to thank @elipowell and @steemit INC team for sharing the current situation of Steemit and I hope to read further updates on that regards more often since it can mitigate uncertainties and speculations.
I think steemit has started to work towards a more sustainable organisation, I really like the way the express the new vision and new objectives however I still haven’t read so many :-).
…but still I think BTC can touch the 9400 USD support since there is still margin on the RSI to reach an oversold condition…
As I said yesterday, every drop of the market is now an opportunity for the accumulation during Bull Trends.
I have filled one of my Buy Orders at 9700 USD and it seems that BITCOIN found some support at 9660 USD, just a little below and above what I considered as the end of the A-B-C correction at 9400USD…
Volume on the 4h chart seems willing to recover also so the correction may be done, however it is not yet confirmed…
I would like to see the resistance of 11300 broken in order to get the final confirmation.
Enjoy!
@toofasteddie
Disclaimer: This is just my personal point of view, please, do your own assessment and act consequently. Neither this post nor myself is responsible of any of your profit/losses obtained as a result of this information.
A few days ago we looked at the weekly price chart of bitcoin and saw why it was a screaming sell and primed to pullback. We’ve gotten a pullback to the first key level and price is showing some resilience now.
Seller Bounce or Reversal Toward Higher Levels?
Looking at the daily chart above you can see we have a reversal pattern in the workings. Today’s candle needs to close above 10,500 for it to be valid, right about where price is at the time of this post.
That would give us the bullish-turn pattern I use for entry signals. However, is the a new long-term entry or just a trade?
I say it is just a trade as nothing has changed on the weekly chart. It is still extended from the 10 period average and this is the first candle after that nasty reversal candle that marked the end of last week.
Price has tested the 9,800 level I have mentioned in the past and is bouncing off of it. Maybe that is the only test of it and we move higher, but I can’t help being a skeptic and thinking it will test it again, especially with 10K being such a psychological number.
See below..
Conclusion
With all that said I’m staying nimble and will enter long for trades only for the time being. If this daily candle gives what we want I will take a shot.
Is Bitcoin Really Selling for $76,000 in Zimbabwe? ;
? Daily Crypto Calendar, July, 2nd?
STEEM Trading Update
Welcome to the Daily Crypto News: A complete Press Review, Coin Calendar and Trading Analysis. Enjoy!
? Binance Exchange to Launch Crypto Futures Trading with 20x Leverage
Binance, the world’s largest cryptocurrency exchange by trading volume, is soon to launch futures trading.
During a presentation at the Asia Blockchain Summit in Taipei on Tuesday, Changpeng “CZ” Zhao, founder and CEO of the exchange, showcased a futures trading interface on Binance with features including longs and shorts on crypto assets.
“Binance will be launching a futures platform very soon. I don’t have the exact date yet. The simulation test version will be live in a few weeks,” he said. Referring to the screenshot of the interface showed on the stage, Zhao added:
“This is an actual screenshot of the working system. So Binance futures is coming.”
Bitcoin has dropped below $10,000 for the first time in 11 days, reinforcing the buyer exhaustion signaled by the weekly chart, as discussed yesterday.
The daily chart indicators have turned bearish, while the 4-hour chart is reporting a bearish lower-highs, lower-lows pattern. As a result, the price could slip further toward the former resistance-turned-support of $9,097 (May 30 high) in the next couple of days.
A UTC close below $9,097 would invalidate the bullish setup on the daily chart.
A high-volume break above the falling trendline on the 4-hour chart, currently at $11,100, would shift risk in favor of retest of the recent high of $13,880.
Masterchain, a blockchain project backed by Russia’s central bank, is falling behind on its goals two years after inception. Sberbank, the leading bank in Russia, is unsatisfied with the system’s speed, security and overall efficiency after testing it.
The bank is looking to shift its work to other enterprise platforms, Sberbank’s blockchain lab head said.
United Kingdom bitcoin (BTC) mining operator Argo Blockchain surpassed its own expectations in Q2, the company said in a new report released on July 2.
Argo, which previously said it had benefited from the upturn in bitcoin prices, said revenues would continue to improve over previous estimates.
“The Company now expects to generate 161 BTC, or GBP1.38m of cryptoassets, in June based on a BTC price of $10,817.16 USD as of 30 June 2019,” the report confirmed.
“This is an increase of approximately 101% from the Company’s May mining results and represents a mining margin of roughly 81%. The Company considers that this demonstrates that the Company is one of the most efficient miners in the market.”
Bitcoin traders in Zimbabwe and South Africa are seeing skyrocketing premiums on their bitcoin (BTC), according to a report from financial news outlet Fxstreet on July 2.
Amid new capital controls in South Africa and Zimbabwe’s recent ban on local trading in foreign fiat currencies, local traders have reportedly seen asking prices of as high as $50,000 per 1 BTC if they attempt to purchase the coin from abroad.
At press time, bitcoin is trading above $10,915 on South African crypto exchange Luno, according to CoinMarketCap data — 10.5% above its price point on Cointelegraph’s bitcoin price index.
Meanwhile, other commentators on social media this week claimed that bitcoin is allegedly trading at as high as $76,000 in Zimbabwe — a premium of over 600%. As appears to be corroborated by screenshots from P2P site LocalBitcoins.com shared on Twitter, at least a scattering of traders have attempted to pocket colossal gains at an asking rate of $75-76,000:
NPXS BEP2 integration and XWallet auto-swap, withdrawal, and deposit planned before July 1.
STEEM Trading Update by my friend @cryptopassion
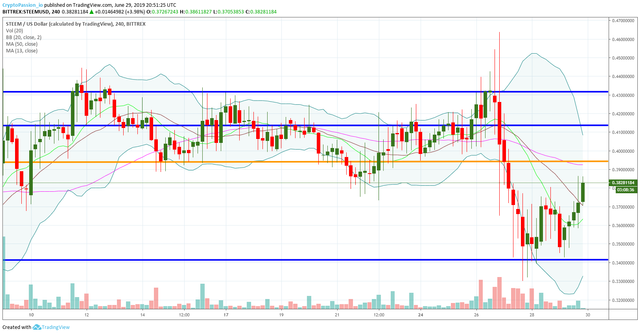
Here is the chart of yesterday :
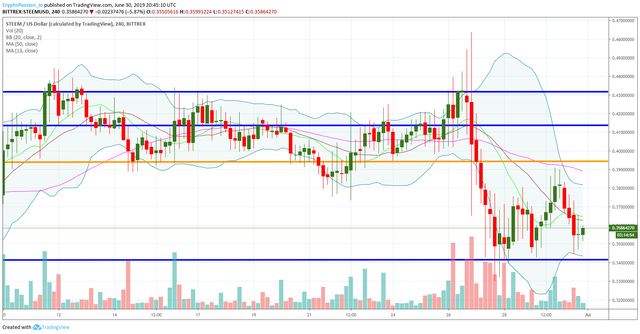
Here is the current chart :
it was too nice to be true on the STEEM. The W pattern that we started yesterday has been invalidated today and we did go test again the support line around 0.34$. The support line at 0.34$ did its job but it is really possible that we finish to break it in case of acceleration of the correction on the BTC.
In Elliott Wave terms, STPT began a wave one advance on June 15. The red wave one (blue sub-waves i-ii-iii-iv-v) finished on June 28, and the red wave two (blue sub-waves a-b-c) correction could have ended today. If this wave count is correct, STPT should be heading next towards the June 28 peak in the red wave three.
Standard Tokenization Protocol is an open-source standard defining how tokenized assets are issued and transferred while complying with all necessary regulations. BlockchainBrad interviewed the CEO back in May this year.
In Elliott Wave terms, RLC began a wave one advance on December 15, 2018. The red wave one (blue sub-waves i-ii-iii-iv-v) finished on May 15 this year, and the red wave two (blue sub-waves a-b-c) correction ended on June 27. If this wave count is correct, RLC should be heading next towards the May 15 peak in the red wave three.
RLC is the native token of the iExec cloud platform. In exchange for RLC tokens, users can utilize the network to rent servers, data and applications. You can watch their latest hype video below.
Data form mobile app analytics firm App Annie shows that, while in the first half of 2018 there were 65.8 million cryptocurrency-related app downloads, in the first six months of this year there were 67 million, an increase of about 1.82%.
This growth is not nearly as sharp as that reported in previous years, considering that the first half of 2017 saw 28.2 million crypto apps downloads from 2016’s 15.3 million, a 45% increase.
There is never a dull moment in the world of blockchains and cryptocurrencies.
The two earth-shattering stories of the past two weeks – the launch of the Libra project and the wild swings in the bitcoin market – might seem like unrelated topics. And, for the most part, the causal impact of the former on the latter is probably not much greater than that of another oft-noted bitcoin price correlation: the avocado chart.
However, the coincidence of these two developments does speak to how globally impactful Satoshi Nakamoto’s invention has now become.
From that wider perspective, these two developments are not at all unrelated. Indeed, they both capture elements of a massive, worldwide financial transformation, all happening at a time of growing economic uncertainty.
Last weekend, two privacy coin conferences heralded the future of cryptocurrency governance: the hybrid startup model versus grassroots experimentation.
Over 200 people gathered in Croatia for Zcon1, organized by the nonprofit Zcash Foundation, while roughly 75 attendees gathered in Denver for the first Monero Konferenco. These two privacy coins are fundamentally different in a variety of ways on clear display at their respective events.
Zcon1 had a gala dinner with a seaside backdrop and programming that displayed close relations between companies like Facebook and the zcash-centric startup Electronic Coin Company (ECC), as evidenced by Libra being widely discussed with team members in attendance.
German Blockchain-as-a-Service (Baas) provider Advanced Blockchain AG has become the first blockchain development firm to be listed on Germany’s Xetra digital stock exchange, operated by Deutsche Börse. The news was reported by financial news site DGap on July 1.
The Xetra all-electronic trading system was founded in 1997 for use on the Frankfurt Stock Exchange, but has since expanded to over 200 trading participants from across16 European countries, as well as Hong Kong and the United Arab Emirates.
According to recent data, Xetra accounted for €131.4 billion ($149 billion) of Deutsche Börse’s total cash markets €146.0 billion ($165 billion) turnover in May 2019, with an average daily Xetra trading volume of €6 billion ($6.79 billion).
Gemini is hoping to achieve what rival Coinbase couldn’t: successfully building out a presence in Chicago aimed at luring high-speed traders to the incipient cryptocurrency market.
The New York-based firm, led by twin brothers Tyler and Cameron Winklevoss, announced Thursday the new outpost for Gemini, which will scale its existing colocation data centers. In an interesting twist of fate, the firm says it has brought on a number of engineers who previously worked for Coinbase’s Chicago office, which was shuttered in April.
Gemini shooting its shot
A person familiar with the situation told The Block Gemini attempted to recruit several employees who previously worked for Coinbase. They have brought on five, according to reporting by CoinDesk.
NPXS BEP2 integration and XWallet auto-swap, withdrawal, and deposit planned before July 1.
STEEM Trading Update by my friend @cryptopassion
Here is the chart of yesterday :
Here is the current chart :
it was too nice to be true on the STEEM. The W pattern that we started yesterday has been invalidated today and we did go test again the support line around 0.34$. The support line at 0.34$ did its job but it is really possible that we finish to break it in case of acceleration of the correction on the BTC.
I’ve been keeping an eye on the weekly chart of Bitcoin and some other big cap coins. Starting this week they all looked a bit extended and I was 50/50 on whether price would push higher.
For a while price did, but with the sell off in recent days you can see price is digesting the prior move (or maybe purging).
A Bigger Picture
Looking at this weekly chart of Bitcoin we see what is a huge reversal type candle that will be formed unless we get a sick rally in the next 8 hours.
That upper wick is one of the biggest I have seen and shows sellers came in hard above the 11,500 area, which ironically was my upside profit target when BTC pushed above 10k.
It’s hard for me to get long when seeing this type of price action on the larger timeframe.
There was a rule that I was taught often back when I was a full-time equities trader.
Larger Time Frames Dominate
Conclusion
This is not to say price cannot go higher in the near-term. In fact price could rally 1k or more points and still technically not breach the reversal candle.
It is a warning signal though – that price has a higher probability of moving lower before it moves higher over the next week.
I’m trying to decide if I want to lighten my BTC position or not to be honest.
In Elliott Wave terms, TokenCard began a wave one advance on January 28. The red wave one (blue sub-waves i-ii-iii-iv-v) finished on March 1, and the red wave two (blue sub-waves a-b-c) correction ended on May 20. If this wave count is correct, TokenCard should be heading next towards the March 1 peak in the red wave three.
When the price of a coin is pushing ever higher people get excited and want in on the action. I suppose that is when the FOMO kicks in.
Vertical Line Equals Do Not Buy
The example for today happens to be ChainLink (LINK) which has ripped higher for several reasons, one of which is just being listed on Coinbase the other day.
Here is the chart from 10 hours ago – wow look at it go. I better get in it’s going straight to 10 right!?!
Here is a chart from the time of this post:
And that is why you don’t buy a coins that has gone vertical in price appreciation.