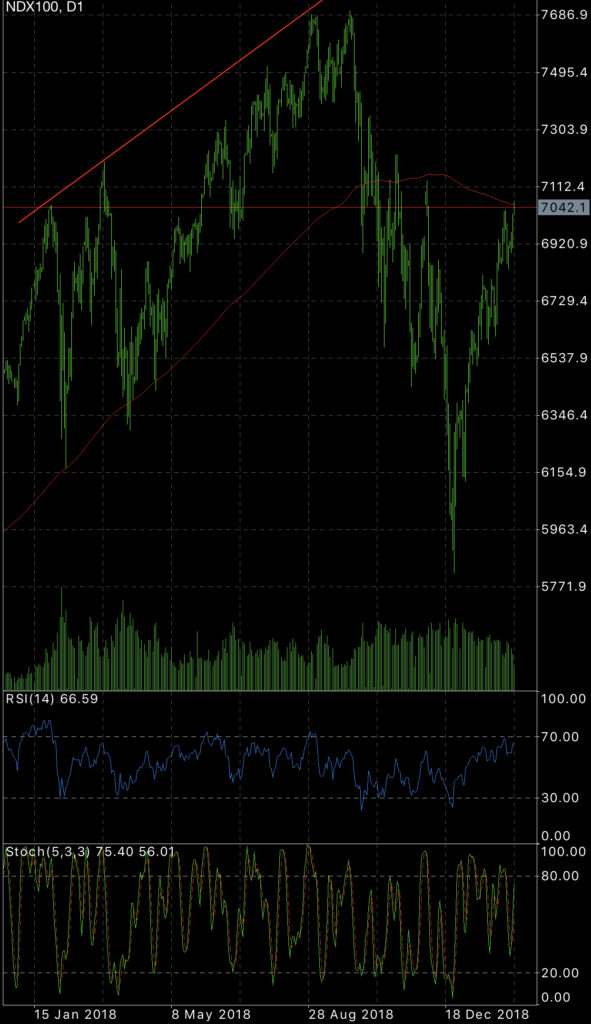
$NDX has hit the 200 day…now we reverse?

The NDX has hit the 200 day this morning after tapping up overnight. Now we have all 3 MAJOR exchanges hit the 200 day including the Dow, S&P, and the Nasdaq. The IWM is still weaker and has not touched the 200 which is actually more for the bear case here. The market has rallied up 8 weeks in a roW, and I believe since the NDX has now touched the “magical line” it gets rejected there.

Iam Shorting the NDX here at 7041 buy longing SQQQ. I am looking for a decent pullback and deciding from there. If it busts
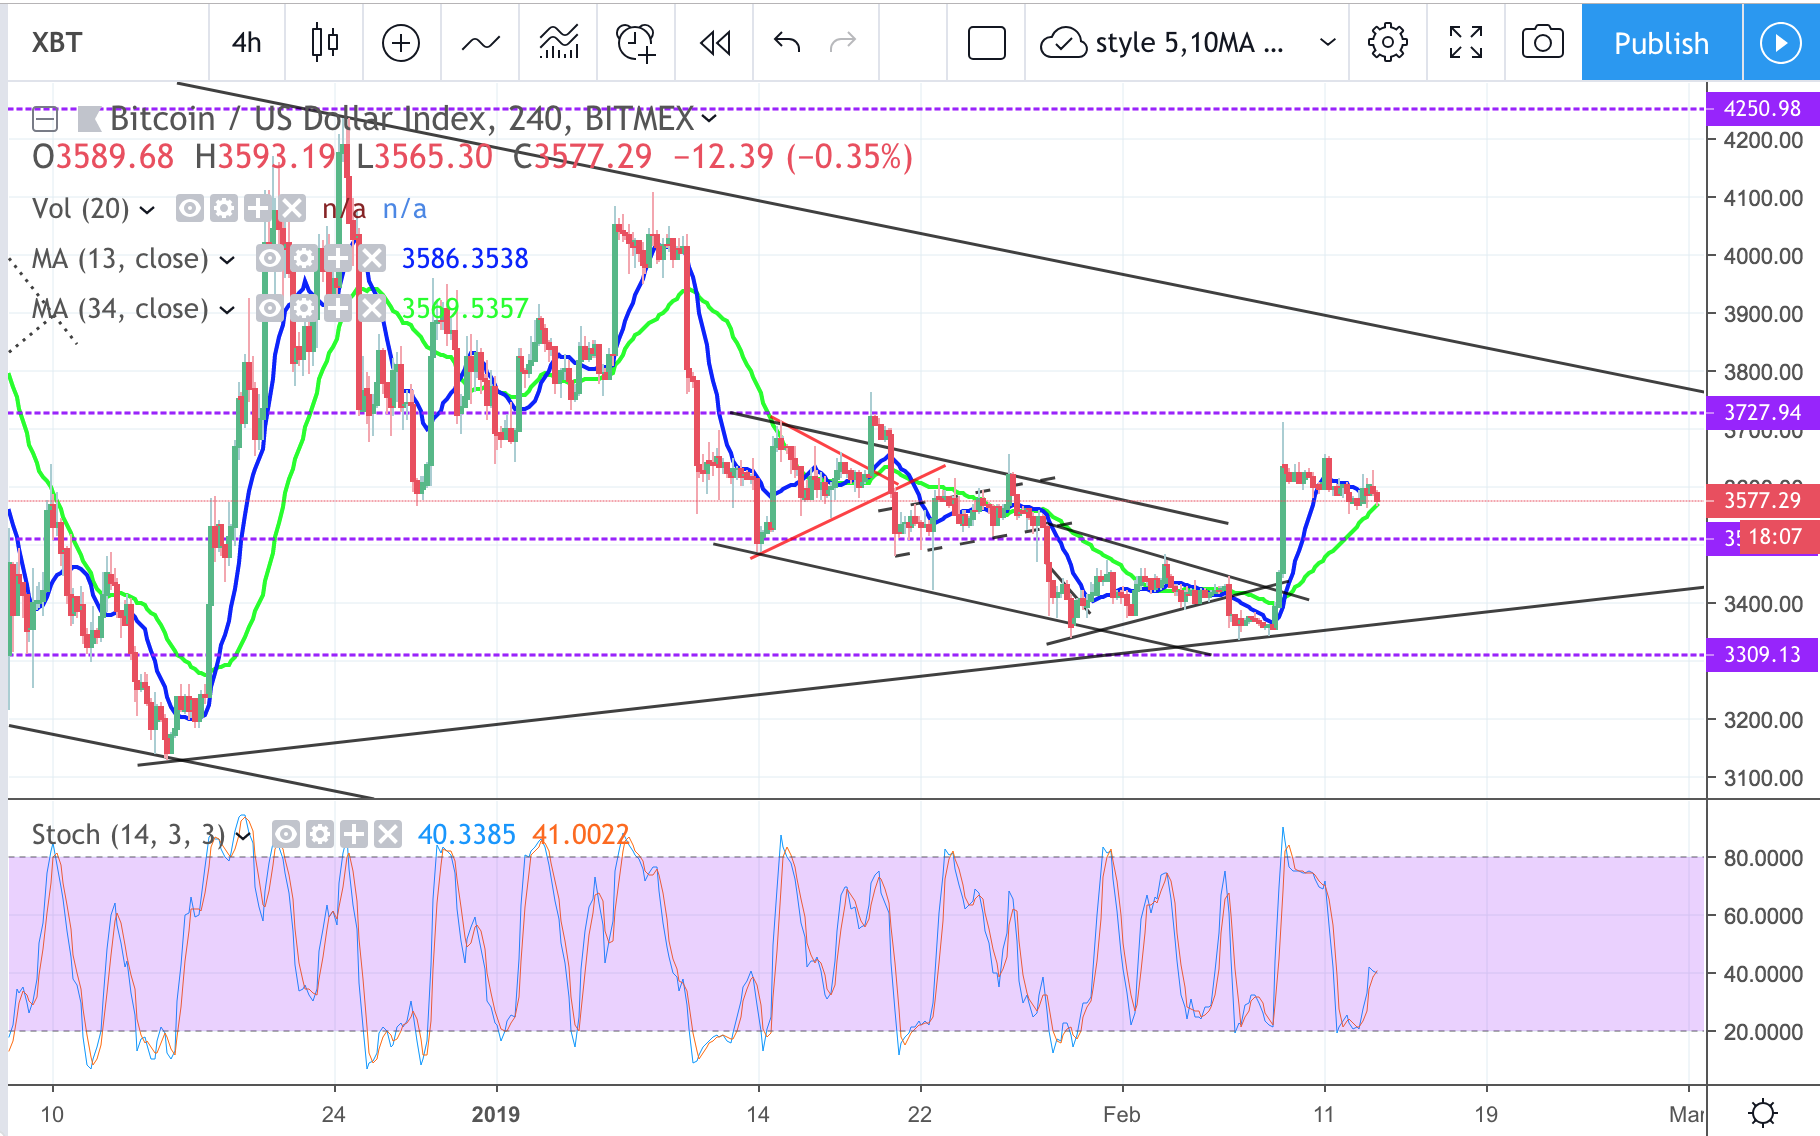

BITCOIN – 13 Feb

On 4hr chart, about time for consolidation to breakout. Which direction it gonna head ? Possible 2nd leg up staircase pattern to test 3700 zone then consolidate again till near big triangle/channel top resistance for next move. On daily looks like there support strength around 3530 which it may test before that then bounce. Possible for downside selloff to triangle bottom but not likely yet.
News: (Current) | (Upcoming)
Short term moving average (day candle) :
RSI :
Network Value to Transactions Ratio :124
Total marketcap :120
Dominance :52.7
Bitfinex Margin Long/Short Volume Ratio :
Depth Chart : (S) | (R)
Weekly Timeframe :
HOT ~ !!
►FREE to Play and

Church And Dwight Needs To Pray

Church & Dwight reported earnings this last week.

Finally, shares of Church & Dwight fell 7.5%. The maker of consumer brand products like Arm & Hammer, Oxiclean, and Waterpik said that sales grew more than 4% in the fourth quarter of 2018 on an organic basis, with especially strong 9% gains internationally.

Yet even though results in the consumer international and consumer domestic segments were solid, Church & Dwight saw a big drop in net sales of specialty products. Moreover, investors were concerned about the impact of tariffs, which was a significant cause of a 2.5-percentage-point drop in gross margin to

Crypto Contest February 13: Odyssey

Odyssey (Bittrex: OCNBTC) has broken out of the triangle pattern in the daily chart.

(Chart courtesy of Tradingview.com (log scale))

Elliott Wave Analysis

In Elliott Wave terms, Odyssey began a wave one advance on August 14, 2018. The red wave one (blue sub-waves i-ii-iii-iv-v) finished on October 17, 2018, and the red wave two (blue sub-waves a-b-c) correction ended on February 10 this year. If this wave count is correct, Odyssey should be heading next towards the October 17, 2018 peak in the red wave three.

(Chart courtesy of Tradingview.com (log scale))

Funnymentals

Odyssey’s mission is to build the next-generation decentralized sharing ecomony & peer-to-peer ecosystem. Odyssey

Crypto Analysis Report 2-12-19…Litecoin Is At Another Critical Level

The last time I spoke about Litecoin, price was at a do or die price level,

Crypto Analysis Report 1-20-19…Litecoin Is At A Critical Level

The level to pay close attention to on Litecoin is the $30 level. Not only is this a psychological round number, but price is attracted to this level going back all the way to May 2017.

So if price breaks below $30, the pivot low at $22 must hold. If price breaks above $30, the next test will be the daily supply at $44.

Not only did price hold the $30 level, but breached the $44

Latest BTC prediction holding strong

A prediction of mine from 8 Feb is right so far.

I published it in my Fib levels post of 10 Feb. I might as well milk it for all it’s worth while it remains correct!

This is the chart I’ve been using – the arrows are unchanged since I first drew them.

Made by Bit Brain with TradingView

Why am I showing you this now? To demonstrate how good I am? No – that’s not it. Okay, that is it a little bit, but there is more to it than that!

There is much excitement in the crypto world at the moment. People

$SPX has hit the 200 day MA…

Over the past couple weeks with buyers stretching the tape to the upside it appeared that this 200 day tap was inevitable. In fact the Dow and SPX have both touched the 200 day and I expect the NDX to do this sometimes this week. One cannot dent that it appears this rally is pressing upwards until the shorts get squeezed and the fund managers have to chase. This is now 8 straight green candles on the SPY chart and many are on the sidelines (Including myself). This rally did not let anyone in.

So what now? With this extension we

$SPX has hit the 200 day MA…

Over the past couple weeks with buyers stretching the tape to the upside it appeared that this 200 day tap was inevitable. In fact the Dow and SPX have both touched the 200 day and I expect the NDX to do this sometimes this week. One cannot dent that it appears this rally is pressing upwards until the shorts get squeezed and the fund managers have to chase. This is now 8 straight green candles on the SPY chart and many are on the sidelines (Including myself). This rally did not let anyone in.

So what now? With this extension we

Bitcoin Technical Analysis: QUICK UPDATE

Bitcoin broke below the $3,600 support (on Coinbase). It’s now testing the prior order block between $3,580 and $3,540. Should this break down decisively (4hr candel opening and closing below), I believe a drop to $3,400 will become likely. Looking at the 4 hour chart, we can see the 8, 21 and 55 day EMA’s…
Read on Trybe

Bitcoin Technical Analysis: QUICK UPDATE

Bitcoin broke below the $3,600 support (on Coinbase). It’s now testing the prior order block between $3,580 and $3,540. Should this break down decisively (4hr candel opening and closing below), I believe a drop to $3,400 will become likely.

Looking at the 4 hour chart, we can see the 8, 21 and 55 day EMA’s are converging with the 50 and 200 day MA. The Bollinger bands are also bottlenecking. This suggests a larger move may be coming in the next 24-48 hours.

In today’s video analysis I discuss where price may be heading next, traps to avoid and so much more.