Playing Both Sides Of Under Armour

Under Armour Inc. will report fourth-quarter financial results pre-market Tuesday. Analysts largely expect the quarterly report and the 2019 forecast to be inline with the forecasts provided at the company’s December 12th investor day in which they disappointed investors by forecasting low-single-digit-sales growth in North America over the next five years.  

But that didn’t stop the stock from rising 17% in January, even received an upgrade from Goldman Sachs on January 22nd with a price target of $28.  However, did the price rise to fast in too short of a span? 

Analysts will be paying close attention to what Under Armour footwear sales and

Playing Both Sides Of Under Armour

Under Armour Inc. will report fourth-quarter financial results pre-market Tuesday. Analysts largely expect the quarterly report and the 2019 forecast to be inline with the forecasts provided at the company’s December 12th investor day in which they disappointed investors by forecasting low-single-digit-sales growth in North America over the next five years.  
But that didn’t stop the stock from rising 17% in January, even received an upgrade from Goldman Sachs on January 22nd with a price target of $28.  However, did the price rise to fast in too short of a span? 
Analysts will be paying close attention to what Under Armour footwear sales and

Crypto Contest February 12: Dash

Dash (Poloniex: DASHBTC) has broken out of the triangle pattern in the weekly chart.

(Chart courtesy of Tradingview.com (log scale))
Elliott Wave Analysis
In Elliott Wave terms, Dash began a wave one advance in November 2015. The red wave one (blue sub-waves i-ii-iii-iv-v) finished in September 2017, and the red wave two (blue sub-waves a-b-c) correction ended in December 2018. If this wave count is correct, Dash should be heading next towards the September 2017 peak in the red wave three.

(Chart courtesy of Tradingview.com (log scale))
Zooming out in the monthly chart, I believe Dash is currently in the red wave three (blue sub-wave

Crypto Contest February 12: Dash

Dash (Poloniex: DASHBTC) has broken out of the triangle pattern in the weekly chart.

(Chart courtesy of Tradingview.com (log scale))
Elliott Wave Analysis
In Elliott Wave terms, Dash began a wave one advance in November 2015. The red wave one (blue sub-waves i-ii-iii-iv-v) finished in September 2017, and the red wave two (blue sub-waves a-b-c) correction ended in December 2018. If this wave count is correct, Dash should be heading next towards the September 2017 peak in the red wave three.

(Chart courtesy of Tradingview.com (log scale))
Zooming out in the monthly chart, I believe Dash is currently in the red wave three (blue sub-wave

Crypto Shopping Cart 12 February

I’ve been shopping (again). I like to publish these posts so that you can see if I follow my own advice or not.

This is a rather interesting shopping excursion…

From http://www.pexels.com

Funding the buys:

I finally have some fiat available for crypto, but as is said in “BTC – Trade the channel” it’s all still sitting on an exchange locked up in buy orders – none of which have triggered yet. Thank you very much recent BTC price spike.

I have no intention of raising the prices of my BTC offers. Yes I am DCAing back into BTC, but it’s a modified DCA

BITCOIN

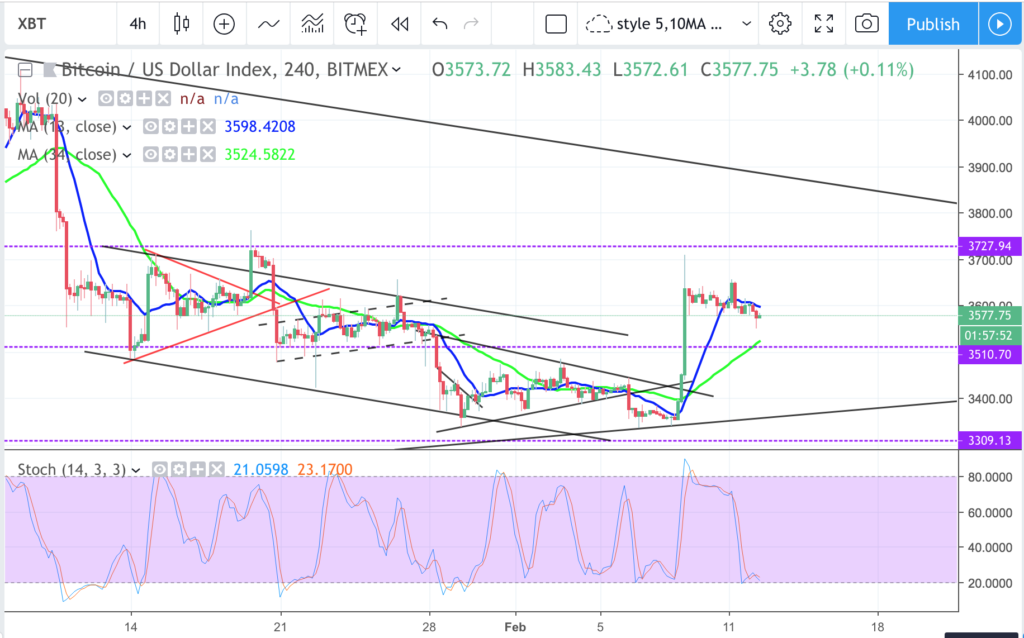
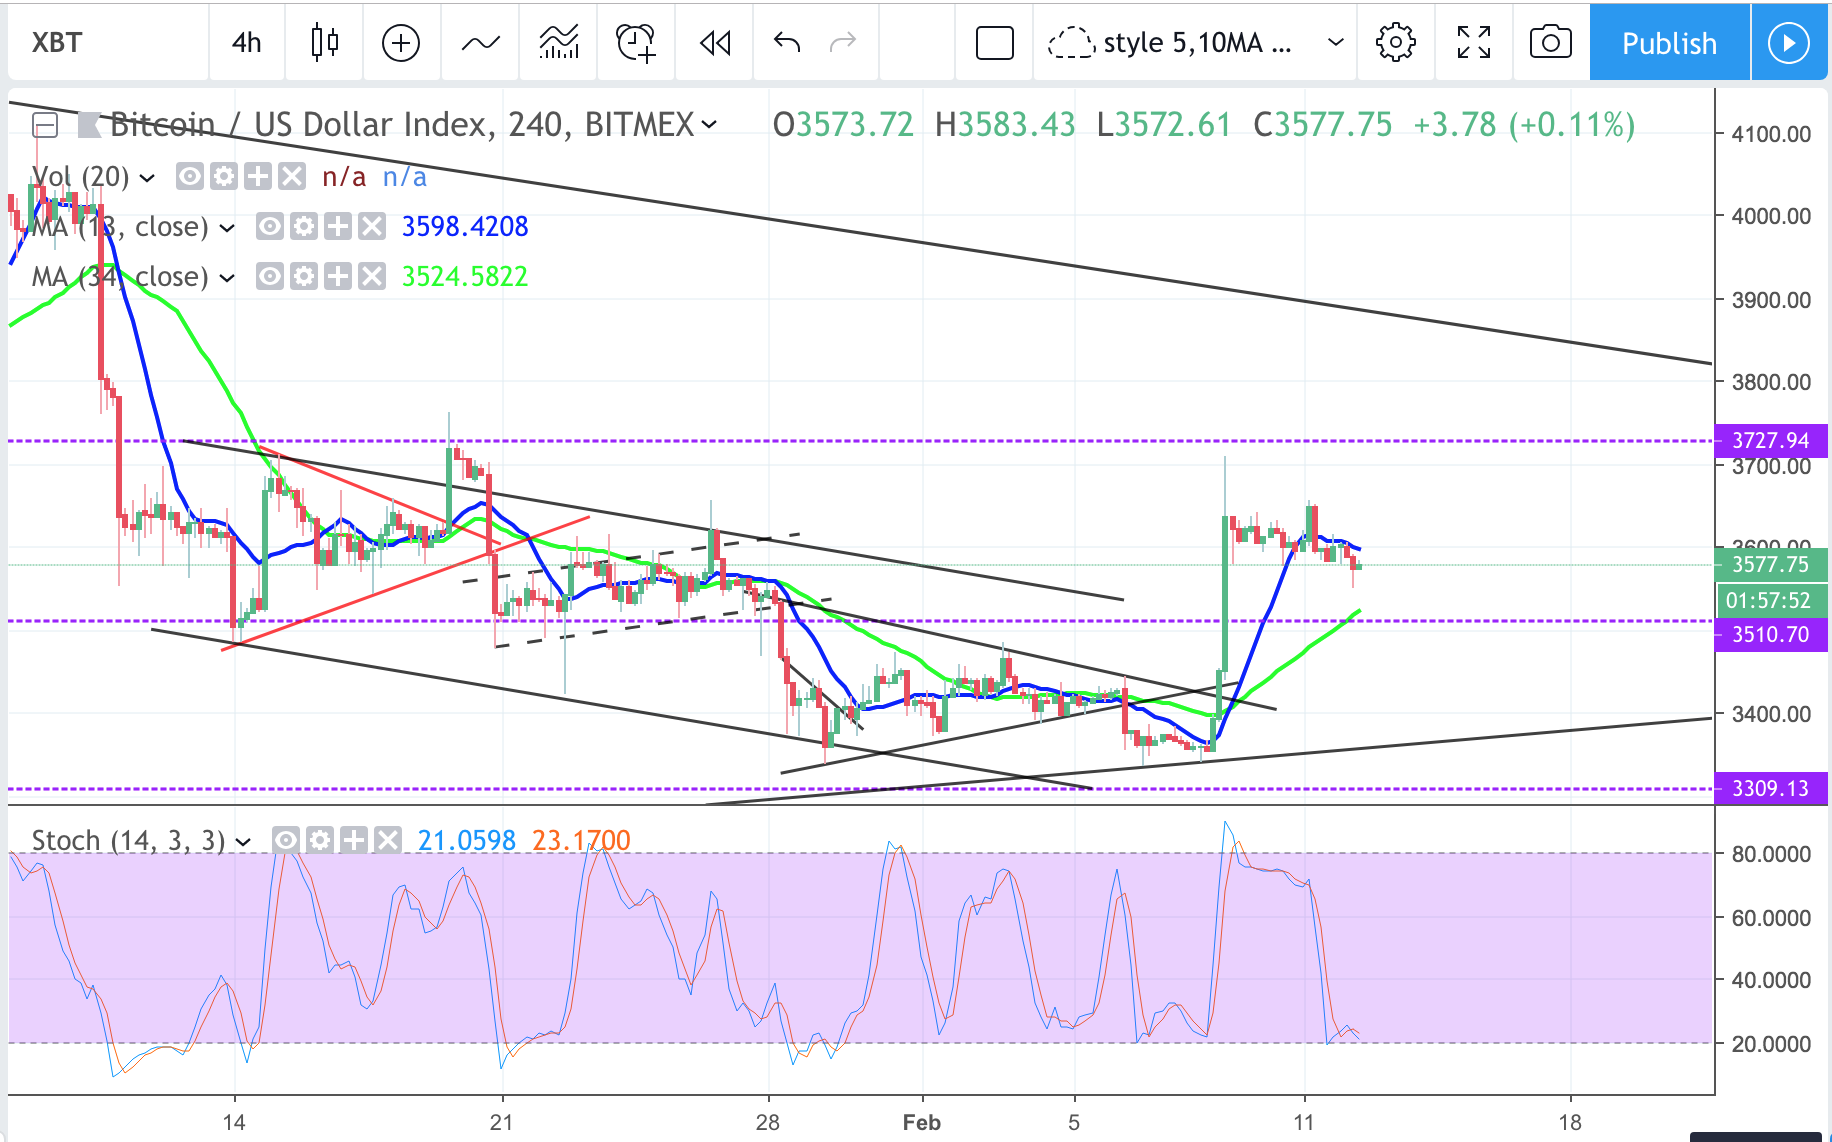
Consolidation to the downside on 4hr chart, towards testing next support 3500 zone. Adjusted the previous triangle bottom, even with a sharp selloff, it might test 3360 triangle bottom first. Still possible for the 2nd leg staircase pattern, upside to test triangle/big channel top around 3800 zone.
News: (Current) | (Upcoming)
Short term moving average (day candle) :
RSI :
Network Value to Transactions Ratio :124
Total marketcap :120
Dominance :52.8
Bitfinex Margin Long/Short Volume Ratio :
Depth Chart : (S) | (R)
Weekly Timeframe :
—
#### Recommended
►You’re gonna post on instagram, youtube, twitter anyway, why not post and earn steem : https://share2steem.io/
►Walk, Jog, Run and Earn steem for moving

BITCOIN

Consolidation to the downside on 4hr chart, towards testing next support 3500 zone. Adjusted the previous triangle bottom, even with a sharp selloff, it might test 3360 triangle bottom first. Still possible for the 2nd leg staircase pattern, upside to test triangle/big channel top around 3800 zone.
News: (Current) | (Upcoming)
Short term moving average (day candle) :
RSI :
Network Value to Transactions Ratio :124
Total marketcap :120
Dominance :52.8
Bitfinex Margin Long/Short Volume Ratio :
Depth Chart : (S) | (R)
Weekly Timeframe :
—
#### Recommended
►You’re gonna post on instagram, youtube, twitter anyway, why not post and earn steem : https://share2steem.io/
►Walk, Jog, Run and Earn steem for moving

RIP: The American Hustle

Has the American hustle died?  That is what made this country great.  Immigrants coming to create a land of better freedoms and opportunities.
However, after being settled as a country for some time now, you know post industrial revolution and now post tech revolution (the first one atleast) it seems we may not be falling into the land of the complacency.
Being on the grind is what made this country great.  No one expected anything, they went out and got it themselves.
Nowadays it seems there is quite a bit of the former.
Like I Owe You Something?
This is just a random example and

CargoX – if you haven’t heard of it – you need to read this!

I haven’t done a CargoX post since I posted this one from my phone while on vacation in early January.

It took me quite a while to remember that I published that directly on Steemit (I’m not even going to attempt to use WordPress through an old phone), I was looking everywhere on my TIMM site for it!

Regular readers will know that I am a big CargoX (CXO) believer. Search the STEEM blockchain for “bitbrain cargox” and you will see… Today I just want to remind you that it is still alive and well and that it is very very cheap!

All