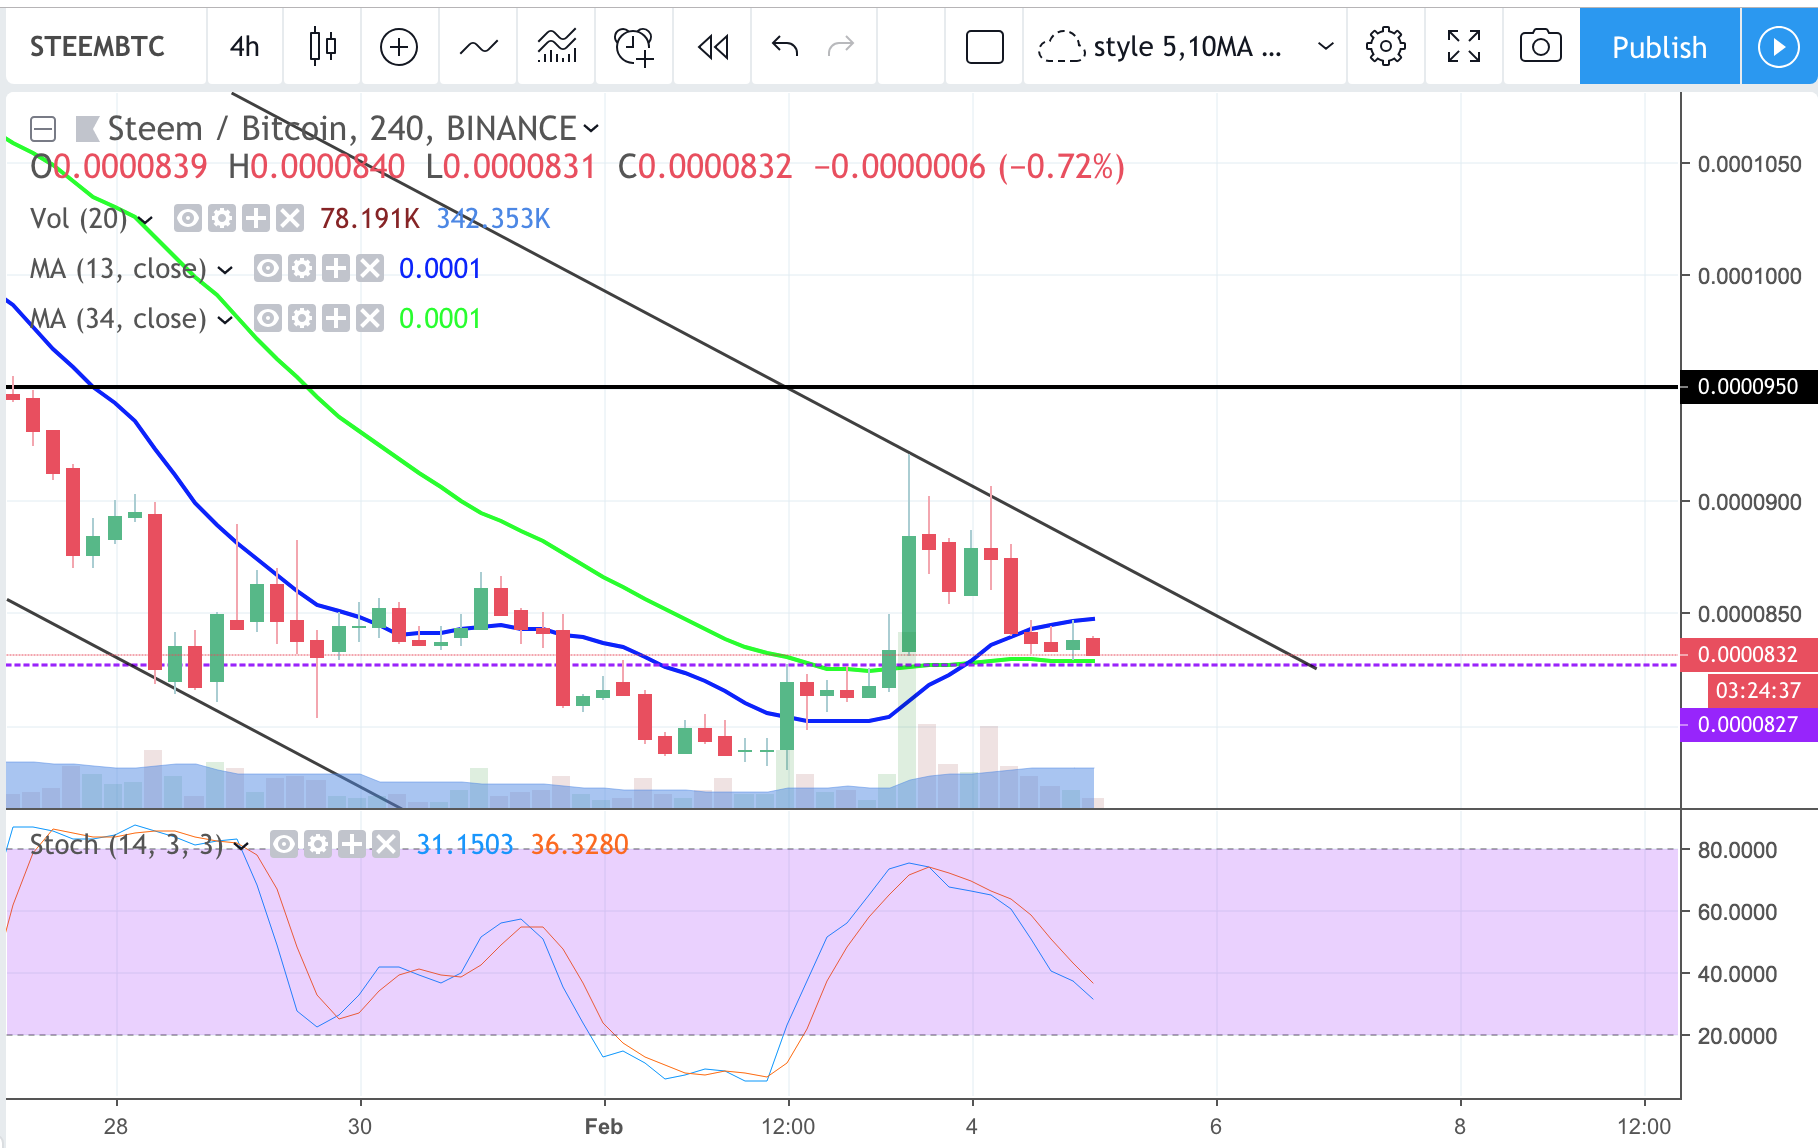
Indeed we have a bounce TD9 with limited upside. Tested the possible channel top resistance and pullback now at support zone 830 on 4hr chart. Still not looking good yet as all waiting for btc next move.
stockpile for short : high (more slow bleed)
Short term moving average (day candle) :
RSI :
SBD/STEEM :
Weekly Timeframe :
24hr change :
Marketcap :90
Volume :543
Current supply :
Total supply :
Debt Ratio :
Daily supply :
Total account :
—
#### Recommended
►Play and Earn steem, blockchain Trading Card Game : https://steemmonsters.com
►You’re gonna post on instagram anyway, post and earn steem : https://share2steem.io/
►Walk, Jog, Run and Earn steem for moving : https://actifit.io
►Sell your upvotes
Tag: steempress
BITCOIN
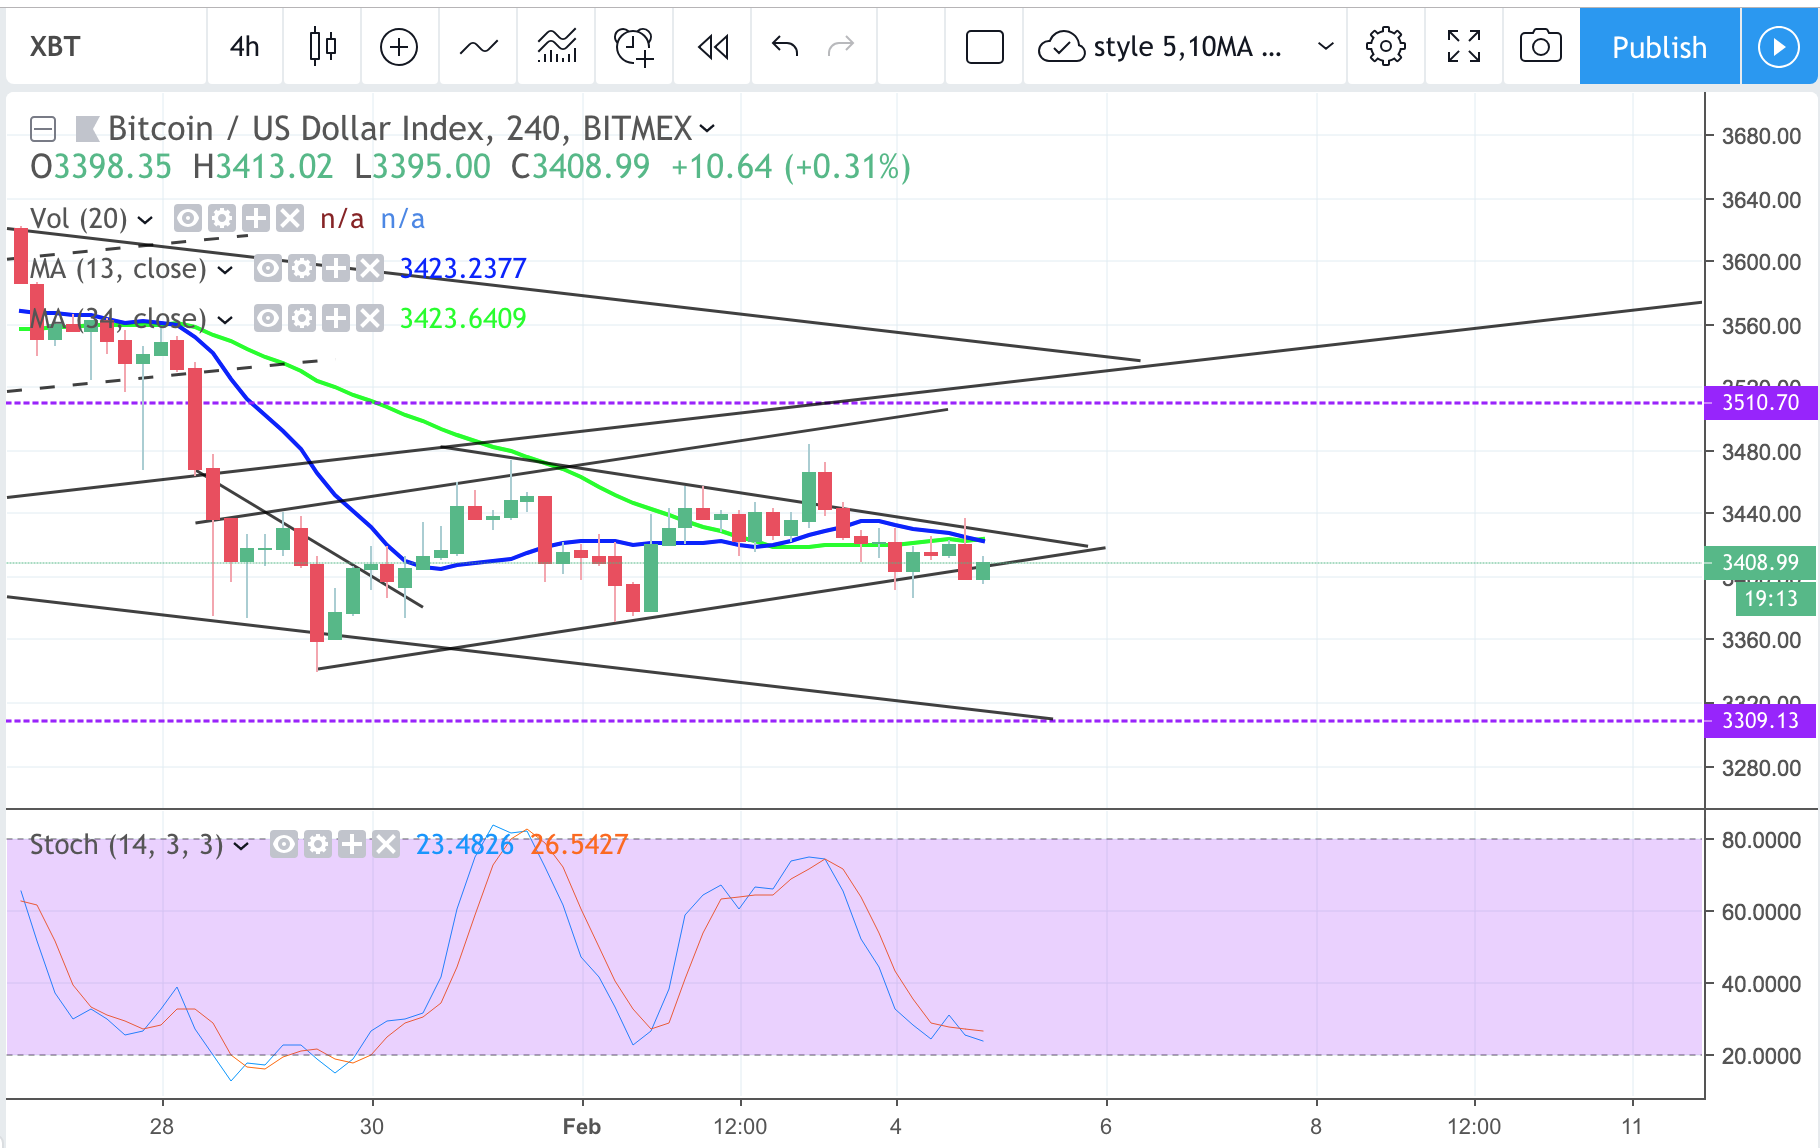
Weekly didn’t close off near 3520, tri star invalid. It close lower though. On 4hr chart, consolidation still valid within possible channel but the triangle bottom seem to be losing it hold, nearing possible triangle apex in next few candles. Possible bounce next few candles but it need to make higher highs else likely to another leg down to test 3300 support which is also the bigger down channel bottom.
News: (Current) | (Upcoming)
Short term moving average (day candle) :
RSI :
Network Value to Transactions Ratio :130
Total marketcap :113
Dominance :53.2
Bitfinex Margin Long/Short Volume Ratio :
Depth Chart : (S) | (R)
Weekly Timeframe :
—
####
Metal Analysis Report 2-4-19…$1330 In Sight – Part 2
About one week ago, I talked about Gold and how the next level gold was going to was the $1330 daily supply level.
Metal Analysis Report 1-26-19…$1330 In Sight
So after basing for the last three weeks, gold finally broke out and closed above the pivot high. Next stop $1330…but this is only the 1st stop.
Gold finally hit the daily supply at $1330 and as the chart suggested, is pulling back.
“We are big gold believers here. Now gold is at $1,300, we think gold is going to $1,400-$1,500. We suggest that everybody have a little bit of
Crypto Contest February 4: Metaverse ETP
Metaverse (Bitfinex: ETPBTC) has broken out of the triangle pattern in the daily chart.
(Chart courtesy of Tradingview.com (log scale))
Elliott Wave Analysis
In Elliott Wave terms, ETP began a wave one advance on March 18, 2018. The red wave one (blue sub-waves i-ii-iii-iv-v) finished on October 14, 2018, and the red wave two (blue sub-waves a-b-c) correction ended on January 28 this year. If this wave count is correct, ETP should be heading next towards the October 14, 2018 peak in the red wave three.
(Chart courtesy of Tradingview.com (log scale))
Funnymentals
Metaverse is a decentralised open platform of smart properties and digital identities. The Next Big
Crypto Contest February 4: Metaverse ETP
Metaverse (Bitfinex: ETPBTC) has broken out of the triangle pattern in the daily chart.
(Chart courtesy of Tradingview.com (log scale))
Elliott Wave Analysis
In Elliott Wave terms, ETP began a wave one advance on March 18, 2018. The red wave one (blue sub-waves i-ii-iii-iv-v) finished on October 14, 2018, and the red wave two (blue sub-waves a-b-c) correction ended on January 28 this year. If this wave count is correct, ETP should be heading next towards the October 14, 2018 peak in the red wave three.
(Chart courtesy of Tradingview.com (log scale))
Funnymentals
Metaverse is a decentralised open platform of smart properties and digital identities. The Next Big
Forex Price Action Baby, No Technicals or Fundamentals…Trade #2 – Sold NZD/JPY
10,000 Foot View – 4 Hr Chart
Zooming In
What I like about this zone is its a level on level zone. Meaning as price left the zone it actually formed another zone as indicated by the yellow circle. Price has already reacted to this lower zone as indicated by the wick (pink zone) denoting sellers in the area.
Because price has been making higher highs and higher lows, this is a counter-trend trade. The trade set-up is offering at least a Reward to Risk ratio of 3:1.
Silver is the Key to Gold $SLV $GLD $SIL
Following up to my $GLD post earlier today I want to touch on silver. Silver is a riskier asset which usually leads Gold (up and down) and outperform gold (up and down). Lately silver is playing catch up and not necessarily leading, however it is sitting at a very precarious spot.
Silver broke down below the lows of 2017 unlike gold. Silver then rebounded back into the wedge what I believe is shaping up to be a “failed breakdown”. These are very powerful signals.
If silver can get above 17.25 i believe it is going to propel all commodities higher and into
Silver is the Key to Gold $SLV $GLD $SIL
Following up to my $GLD post earlier today I want to touch on silver. Silver is a riskier asset which usually leads Gold (up and down) and outperform gold (up and down). Lately silver is playing catch up and not necessarily leading, however it is sitting at a very precarious spot.
Silver broke down below the lows of 2017 unlike gold. Silver then rebounded back into the wedge what I believe is shaping up to be a “failed breakdown”. These are very powerful signals.
If silver can get above 17.25 i believe it is going to propel all commodities higher and into
BITCOIN – waiting for mon market open
Feeling real hard for upside gain and doesn’t stay long. On 4hr chart, fake break from possible triangle, almost tested channel top resistance then pullback again. Possible test of channel bottom, can 3398 hold the consolidation longer ? Weekly candle gonna close off soon, can it push up back into 3520 zone to close off weekly candle tri star pattern ? and will the previous big selloff repeat again after the tri star ? Possible light upside before the next sell off.
News: (Current) | (Upcoming)
Short term moving average (day candle) :
RSI :
Network Value to Transactions Ratio : 130
Total marketcap :114
Dominance
Monomad – Untitled guitarist
This is my entry for the #monomad challenge.
Untitled guitarist at the snooty fox wakefield.
Photographed with Canon Eos 300D (rebel)
f/3.5 1/50sec iso-1600. No flash
Posted to steemit from scripsio using steempress.