Intermarket Relative Strength Analysis Report For The Week Starting 5/12/19

Instead of looking at financial markets or asset classes on an individual basis, intermarket analysis looks at several strongly correlated markets or asset classes, such as stocks, bonds and commodities. This type of analysis expands on simply looking at each individual market or asset in isolation by also looking at other markets or assets that have a strong relationship to the market or asset being considered.

The US economy is still the largest in the world and the US dollar is still the most powerful currency in the world.  Over half of all foreign currency reserves in the world are in
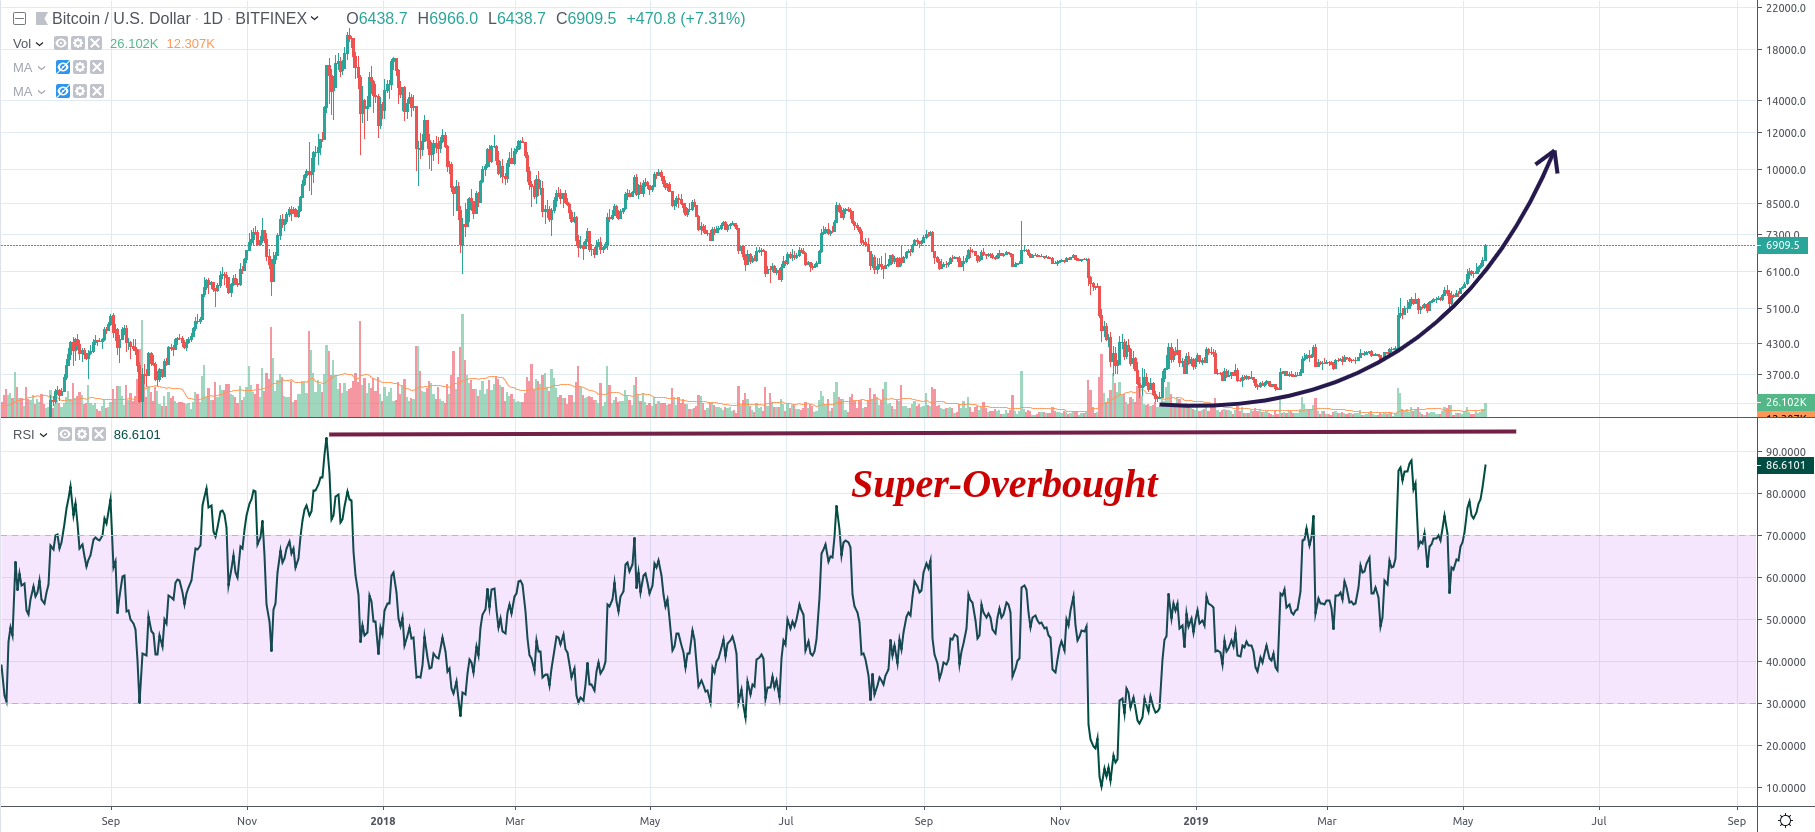
BITCOIN: Flying Parabolically

I almost have forgotten how exciting was the Crypto market till this morning while watching BITCOIN reaching 7000 USD I really get shocked.

Honestly I was not expecting such an accelerated growth. I was prepared to find resistance till 6200 USD but I never thought would be so easy for BITCOIN to break it.

To tell you the truth I am feeling excited while worried at the same time :-)…Excited because finally we reached a significant milestone which is the “balcony” from which the whole market fell down abruptly on November.

Worried because it seems to me an unsustainable rise, frankly speaking… I

My TIMM Trading Pit Commentary – Wk Of 5/6/19

TIMM (Traders’ & Investors’ Mentor Market) provides the tools analysts need to share their insights in a central location, TIMM becomes a market where traders and investors can shop for the insights they’re looking for.The Trading Pits are, in some ways, the main meeting place for TIMM. Here you will see folks sharing insights and asking questions about markets.

Commentary from this past week includes:

S&P 500 futures fills the daily gap.

Nasdaq futures finally found some bids.

Gold sitting between 60 min zones, play the extremes.

Gasoline sitting in a daily demand zone, but may not hold since oil isn’t

BITCOIN: Carefully excited…

And finally, here we have BITCOIN approaching to the most important Resistance Level of the Chart. The range between 6050 and 6400 USD. 

The 50 Day Moving Average in a consistent upwards trend which is nice and positive but….

But what happens with the Total Market Cap? Is it increasing because investors are coming, new FIAT is entering? or…

…is it the pure consequence of the Altcoin “Drainage”?

I’m afraid that the last is the most likely…

Yes, BITCOIN is increasing but most ALTCOINS are in full free-falling mode, and I am not speaking only about our beloved STEEM.

This “positive” trend on BITCOIN is only

My TIMM Trading Pit Commentary – Wk Of 4/29/19

TIMM (Traders’ & Investors’ Mentor Market) provides the tools analysts need to share their insights in a central location, TIMM becomes a market where traders and investors can shop for the insights they’re looking for.The Trading Pits are, in some ways, the main meeting place for TIMM. Here you will see folks sharing insights and asking questions about markets.

Commentary from this past week includes:

Stopped out on Dow futures trade, got back in, was up 100 ticks, got out of trade after I saw price break down again, escape today at breakeven plus commission.

Went long on Dow futures, breaking several of

BITCOIN: uncertainty…

I did not update my Elliot Waves count since more than a week now, thought it is still valid…In my opinion BITCOIN has completed a 3rd and a 4th wave, very short this last one but, despite the steady volume I believe we can see the resume of the upwards move soon forming the final 5th wave of the bigger order 3rd wave, something like this:

However, Shorts has been increased substantially and this is something that may indicate a sudden drop before this count becomes a reality.

Actually, SHORTS are in the “super” Oversold area of the RSI which has never

Scaredy Cat Investor Show – Interview Replay w/ TIMM contributor Rolland Thomas

It took a minute, but here is the recording from my conversation with veteran trader and TIMM contributor, Rolland Thomas!
In this interview we talk everything from crypto to stocks and how to recognize supply and demand zones in order to follow what the big money players are doing in the market!
Click the play button below to hear it all!

Allocation Lesson for Traditional Investment Accounts

Reallocating your investment portfolio is something that should be done atleast annually, but probably every six month at a minimum.
A good friend of mine is a successful financial advisor and he told me that they always reallocating their clients portfolio when warranted, which basically means when the allocation percentages get out of wack due to the increase (or decrease) of a given asset class.
50/50 Allocation
He told me that they automatically rebalance their clients portfolios to 50/50 continuously. Meaning, 50% of an account in invested in different stocks and the other 50% is in fixed assets, such as bonds.
Most people have

BINANCE: Price action is about to happen

Without so much time for writing today, so, short post here.

Symmetrical triangle formation on BINANCE, 4 hours chart:

Volume keeps being constant awhile Stochastic RSI on the daily chart indicates a good moment for buyers.

Every time Stochastic touches the lower limit there is a good jump upwards:

Price action is coming to BINANCE again and if we consider the historical data we have from the last three months the direction of the price movement must be upwards.

Target 28 USDT.

Stop Loss placed at 21.2 USDT.

Enjoy!

@toofasteddie

*Disclaimer: This is just my personal point of view, please, do your own assessment and act consequently. Neither this

My TIMM Trading Pit Commentary – Wk Of 4/22/19

TIMM (Traders’ & Investors’ Mentor Market) provides the tools analysts need to share their insights in a central location, TIMM becomes a market where traders and investors can shop for the insights they’re looking for.The Trading Pits are, in some ways, the main meeting place for TIMM. Here you will see folks sharing insights and asking questions about markets.

Commentary from this past week includes:

Went long on the Dow futures, price nearly hit target…pulling back a bit.

Dow futures approaching a 60 min supply zone.

Oil continues to push higher.

4 hr supply on gasoline futures