Intraday Analysis: SPX Pressing The Upside Range

Over the last several days the S&P 500 has been a bit range bound.  Looking at a shorter time frame, such as the hourly chart we can see this trading action and that the index at this moment is trying to breakout to the upside.
Market Action
The opening bell was 30 minutes ago and despite disappointing earnings from yet another bank, JP Morgan this time, the SPX is pressing higher.

As you can see in the hourly chart above, price action has been stuck in a range the past five trading sessions and the index is now pressing the upside of that

Crypto Contest January 15: VIBE

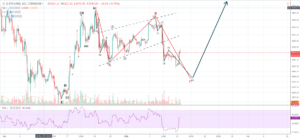
VIBE (Binance: VIBEBTC) has broken out of the triangle pattern in the daily chart.

(Chart courtesy of Tradingview.com (log scale))
Elliott Wave Analysis
In Elliott Wave terms, VIBE began a wave one advance on September 12, 2018. The red wave one (blue sub-waves i-ii-iii-iv-v) finished on September 22, 2018, and the red wave two (blue sub-waves a-b-c) correction ended on December 14, 2018. If this wave count is correct, VIBE should be heading next towards the September 22, 2018 peak in the red wave three.

(Chart courtesy of Tradingview.com (log scale))
Funnymentals
VIBEHub is a virtual and augmented reality metaworld that specializes in using volumetric video

Unusual Options Activity In PG&E Corporation

PG&E faces at least $30 billion in potential liability costs stemming from wildfires in 2017 and 2018, many allegedly started by the company’s equipment, that have led state officials to doubt the safety of the company’s electric distribution system.

Investigators have already determined PG&E’s equipment liable in at least 17 major wildfires in 2017. State investigators are still working to determine if the company’s equipment was partly responsible for November’s Camp Fire, which killed at least 86 people and destroyed about 14,000 homes, making it the state’s deadliest fire.

PG&E Corp. stock cratered Monday after the company said it will file for

BITCOIN: Is the correction finished?

…and the answer is also difficult.

I see two possibilities now at the 4 hour-chart.

The first one: with the last drop, BITCOIN has reached the 5th wave bottom, end of the ZIG-ZAG correction…

3rd wave longer than 1st and 5th… 5th wave short but within the expectations, since “C” is just below “A” Leg… From now on, we should see 5 waves towards the “Target Resistance” in dashed Blue line.

If BTC manages to break that resistance it would be a very good signal of Reversal…

2nd Option (among others, of course…): The assumption would be that still the 4th wave is in play

SPX Bulls Showing Resilience

After quite the bounce last night and some negative news one could think the bears would come roaring down and sell off the market for at least a day, but the bulls seem to remain strong recently.
Bank Miss, China Down
This morning we got the first of what will be many banks reporting their fourth quarter results.  Citi kicked it off with a miss on revenue, which seems to be the expected tone for the banks this earning season from the pundits.
Additionally, data out of China sparked worries over a global slowdown as their import/export numbers were lower than expected.
Don’t Skip

Bitcoin Technical Analysis: PRICES SPIKE, BUT DON’T GET COMFORTABLE YET

Bitcoin’s price spiked from a low of $3,480 to $3,700. It’s currently trading around $3,670 on Coinbase. We know $3,600 was acting as a strong support before prices dropped 2 days ago. Often when a support is broken, it starts acting as resistance. In this case, when price spiked, $3,600 did not act as resistance. This gives bulls some hope for a larger rally. Let’s now see if $3,600 starts acting as support again.

This latest rise in price also came with a drop in long positions. In other words, traders to profit. This is a healthy sign.

Unfortunately, overall daily volume

Cancelled Two Forex Pending Orders

It’s January 13th and I have yet to place a trade in forex 2019. By no means is it due to the lack of volatility. For example, when Apple pre-announced two weeks ago, the Japanese Yen pairs went bonkers. For example, just look at what happened on the USD/JPY.

The pre-announcement occurred after the US session close. During the period between the US close New York and the Tokyo open in Tokyo, few human traders are involved in the forex markets. More than likely the flash crash was algos sniffing the internet for news and sold the Markets when Apple

Crypto Contest January 14: Agrello

Agrello (Binance: DLTETH) has broken out of the triangle pattern in the daily chart.

(Chart courtesy of Tradingview.com (log scale))
Elliott Wave Analysis
In Elliott Wave terms, Agrello began a wave one advance on August 16, 2018. The red wave one (blue sub-waves i-ii-iii-iv-v) finished on October 30, 2018, and the red wave two (blue sub-waves a-b-c) correction ended on December 29, 2018. If this wave count is correct, Agrello should be heading next towards the October 30, 2018 peak in the red wave three.

(Chart courtesy of Tradingview.com (log scale))
Funnymentals
The Agrello platform is a dashboard where you can manage your identity, create contracts,

BITCOIN: Testing and old resistance

Early yesterday we saw a sudden drop of the BITCOIN price followed by a short and shy consolidation movement upwards…

The drop was expected since the Elliot Wave count was alerting about that in order to complete a long 5-3-5 Correction…

The question is, does the drop terminated? It may have been terminated, actually it looks like a very short but probable 5th wave…

In order to know it we have to see how BITCOIN manage in front of the next resistance:

The RSI indicates oversold condition but the Constant Low Volume does not bode high hopes for recovery…

My plan keeps alive, for the

Goldman Sach Just Jumped On The Wagon

About one month ago, I noticed what looked like a smiley face…a bottoming pattern forming on Gold.

Metal Analysis Report 12-7-18…Do You See What I See???

YES, YES, the chart is suggesting price is forming a bottom and also broke the daily down trendline last month.

Then three weeks later, I noticed some bullish unusual option activity on Newmont Mining.  But more importantly, the bottoming pattern was confirmed by the specific pattern that I look for in reversals.

 Unusual Options Activity In Newmont Mining

Then a week later Jim Cramer jumped on the bandwagon. CNBC’s Jim Cramer said on his show, Mad Money that