Crypto Contest February 3: TenX

TenX (Bittrex: PAYUSD) has broken out of the triangle pattern in the four-hour chart.

(Chart courtesy of Tradingview.com (log scale))
Elliott Wave Analysis
In Elliott Wave terms, TenX began a wave one advance on January 10. The red wave one (blue sub-waves i-ii-iii-iv-v) finished on January 21, and the red wave two (blue sub-waves a-b-c) correction ended on February 1. If this wave count is correct, TenX should be heading next towards the January 21 peak in the red wave three.

(Chart courtesy of Tradingview.com (log scale))
Funnymentals
TenX is a Singapore-based blockchain company that makes cryptocurrencies spendable on-the-go. You can view their latest Q&A stream

Simon Property Group, A Barometer For Retail

Simon is a global leader in the ownership of premier shopping, dining, entertainment and mixed-use destinations and an S&P 100 company (Simon Property Group, NYSE: SPG). Their properties across North America, Europe and Asia provide community gathering places for millions of people every day and generate billions in annual sales.

Source

Simon also owns 5 of the top largest malls in the US.

Source

On Friday SPG reported earnings that were short of analysts expectations. The SPG reported revenue of $1.46 billion in the period vs. expectations of $1.5 billion.

For 2018, the company reported funds from operations of $4.32 billion, or $12.13 per

Bitcoin Technical Analysis: BULLS STRUGGLE… IS A LARGER MOVE COMING?

Bitcoin continues to bounce on top of the $3,400 support (on Coinbase). Volume has been declining over the past 48 hours.

Zooming out on the weekly chart, we get much better perspective on just how bearish this overall trend has been. Price broke below the $3,600 support. When it tried to break back above, $3,600 began to act as a strong resistance. The weekly chart suggests price may retest the prior low of $3,130 (on Coinbase). I’m not saying it will, but it’s a very real possibility. I discuss this much more, as well as the bullish scenario, in my video

The Steem Price Optimistic Scenario

By now means am I saying I think this will happen, but technically the possibility is there.  What exactly is it I’m speaking of….
Higher Highs and Higher Lows
In order to have an uptrend price needs to make higher highs followed by a higher low and then a higher high.  (say that three times fast).

Looking at the daily price chart of steem you see we had our last high (which marked the bearish u-turn I called out) and the subsequent selloff to where we are now.
Price has started to turn a little here and if we see any follow through higher

Zayo…Potential Buyout Coming By Mid-March

Zayo Group Holdings, Inc. (ZAYO) through its subsidiaries, provides bandwidth infrastructure solutions for the communications industry in the U.S., Canada and Europe.   Customers include wireless and wireline carriers, media and content companies and finance, healthcare and other large enterprises.

A high frequency trading firm recently selected Zayo Group Holdings, Inc. (ZAYO) for an ultra-low latency (ULL) solution in the the New York/New Jersey financial corridor which will allow them to execute it high frequency trading strategy, where having a microseconds edge makes the difference of racking up multi- millions of dollars in profits. 

NOTE: that’s another topic for a later time.

Last week,

Amazon’s Earnings Results…Read Between The Lines

Amazon reported fourth-quarter earnings of $6.04 a share on revenue of $72.4 billion on Thursday afternoon vs analysts expectation of $5.65 a share on revenue of $71.88 billion. 

However, the stock sold off on Friday because Amazon guidance for the next quarter of $56 billion to $60 billion vs analysts expectations of $60.83. 

The lower guidance was due to increase in spending for 2019 like $5 billion for HQ2 , slowing growth in the US / oversees and challenges in India.

But one must read between the lines:

3rd record breaking quarter of profits with $3 billion of profits for the quarter.

Hiring 5,000

BITCOIN: Bull Flag & Falling Wedge

I know, I know… I have been searching and telling you about it many times lately…

This is becoming boring…BITCOIN is moving terribly slowly…tracing a downtrend path which does not give us positive feelings right now. But, you know, Volume is the key right now. Volume has decreased a little every day, forming a “Falling Wedge” but, essentially is more or less constant if not flat at 5.5b$

The Bullish Divergence is still there and now BITCOIN is approaching to the upper resistance of this Falling Wedge. This breakage is the key now…

If, while approaching to this line, the Volume spikes then it

Finally, A Chance To Short The Cruise Ships – Part 2

Last month I wrote about the cruise ship industry,

Finally, A Chance To Short The Cruise Ships

I have been eyeing the cruise ships for nine months. If the economy is slowing / tanking, consumer will have less and less discretionary funds.

Royal Caribbean, the world’s second-largest cruise company operates more than 50 ships under the brands Royal Caribbean, Celebrity Cruises, Azamara Club Cruises and CDF Croisieres de France.

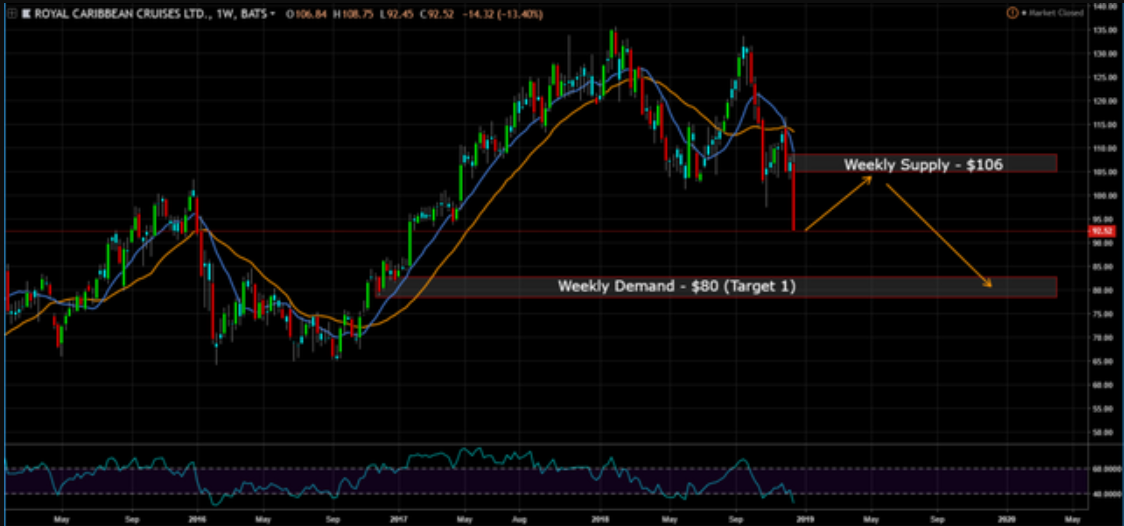
So the trade set-up is if price can pull back to the weekly supply at $106, the chart suggests price will head down to the weekly demand at $80.

Well, I got this one wrong and

Is Fed Powell Wall Street’s Newest Puppet???

During a question-and-answer session Oct. 3, Fed Chairman Jerome Powell said the central bank was a long way from adopting a neutral rate of growth.   The Markets didn’t like what Powell said and showed him by tanking.

Then in December, Powell said the Fed’s program to reduce the bond holdings on its balance sheet was on “autopilot.”  Powell later went on and raised short-term rates another one-quarter percent.  The Markets didn’t like what Powell said and showed him by tanking again.

At this point, the Markets had Fed Powell right where it wanted him.  In early January, during a round table with

Crypto Contest January 31: Ripple

Ripple (Binance: XRPETH) has broken out of the triangle pattern in the daily chart.

(Chart courtesy of Tradingview.com (log scale))
Elliott Wave Analysis
In Elliott Wave terms, Ripple began a wave one advance on August 8, 2018. The red wave one (blue sub-waves i-ii-iii-iv-v) finished on December 19, 2018, and the red wave two (blue sub-waves a-b-c) correction ended on January 5 this year. If this wave count is correct, Ripple should be heading next towards the December 19, 2018 peak in the red wave three.

(Chart courtesy of Tradingview.com (log scale))
Zooming out in the weekly chart, I believe Ripple is currently in the red