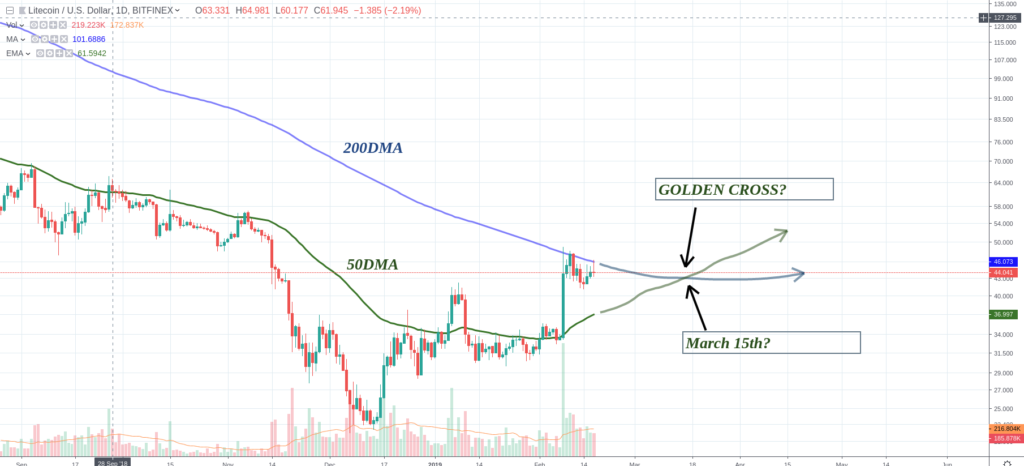
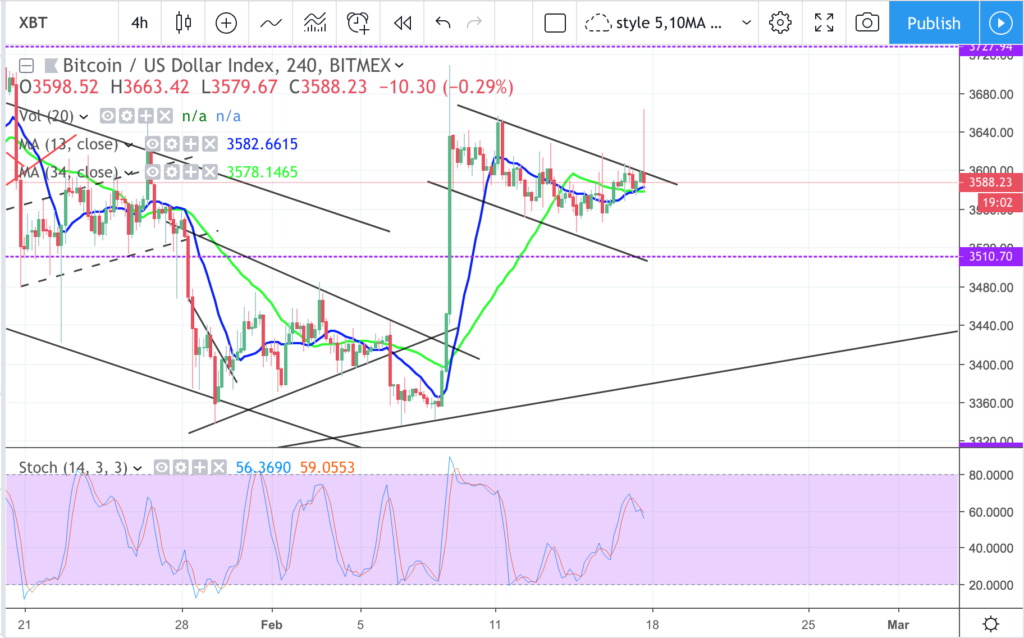
For those who do not know, the “The Golden Cross” is a Candle-stick pattern which indicates a long-term Bull Market going forward. It occurs when a short-term moving average crosses over a major long-term moving average to the upside and it is very used by investors, analyst and traders as an indication of a major…
Read on Trybe
LITECOIN: How far from the “Golden Cross”
February 17, 2019
Published by timm