BITCOIN

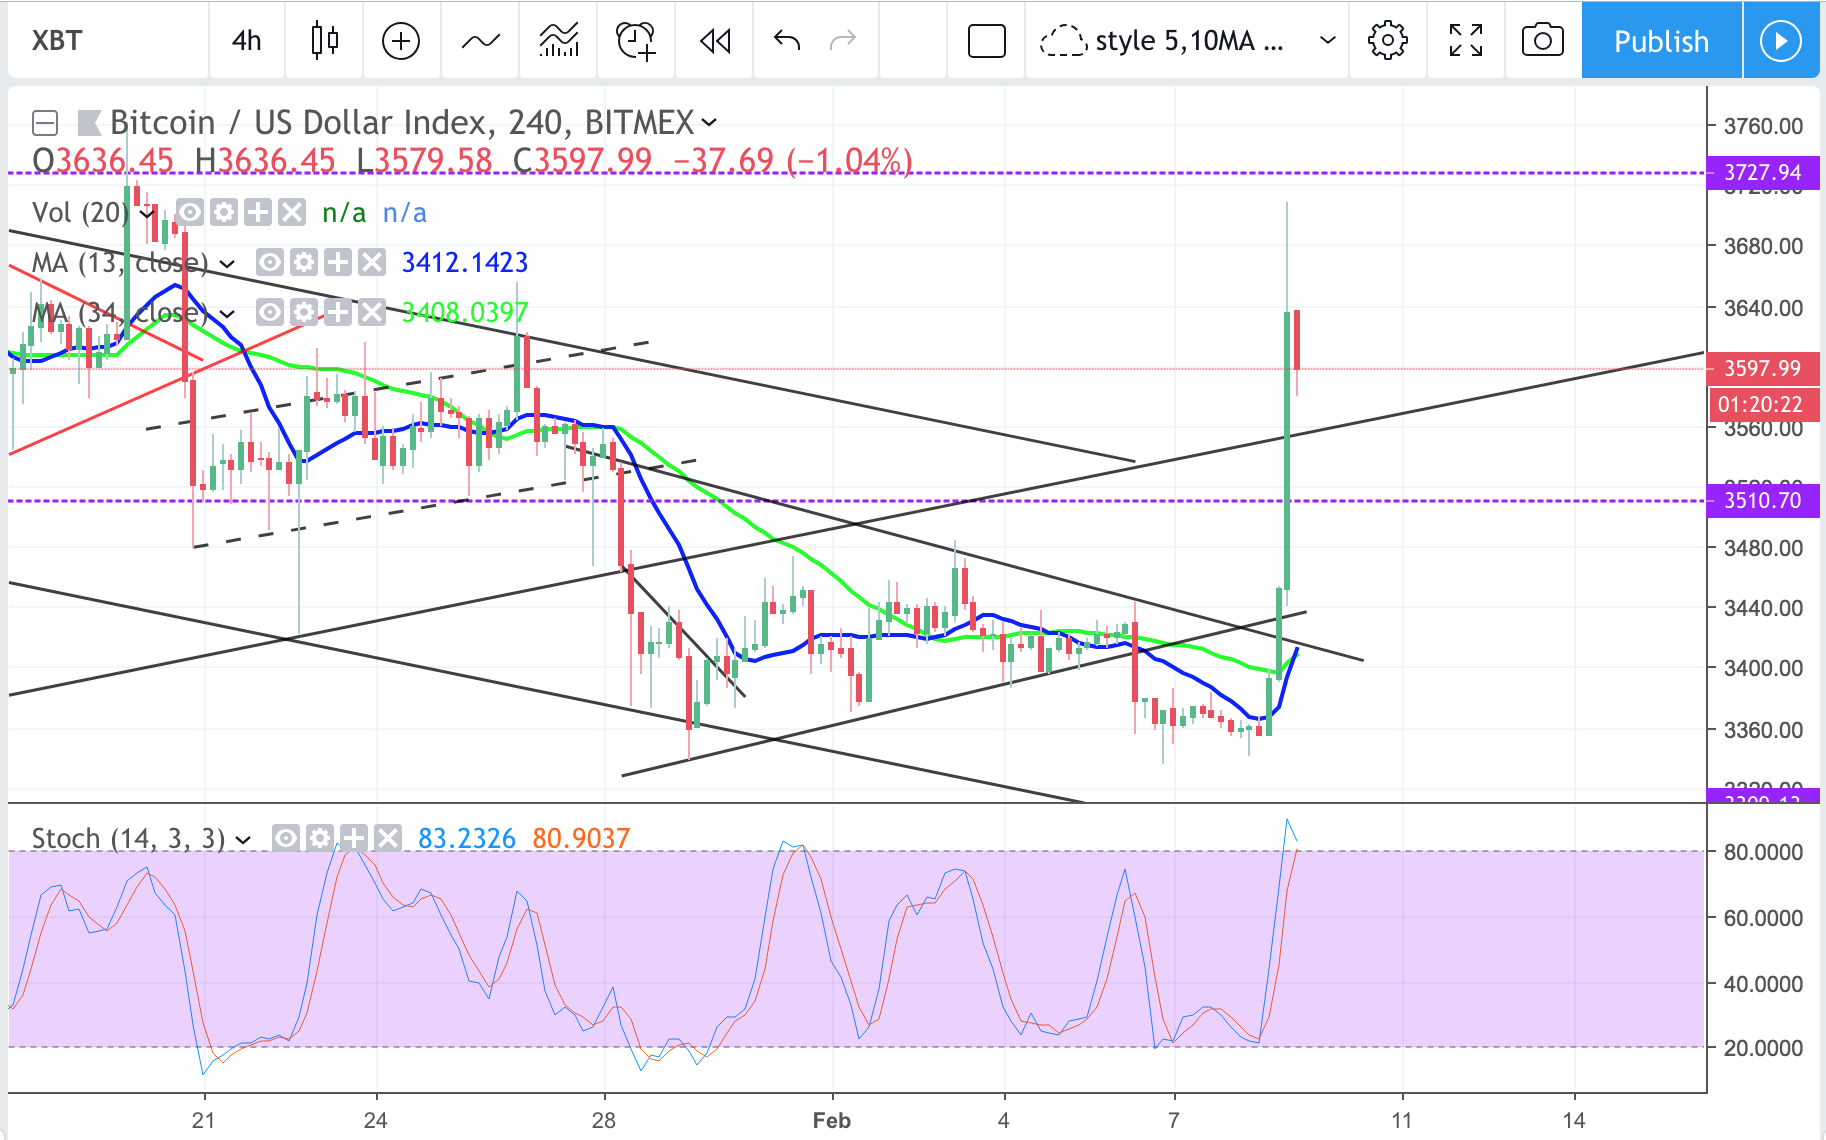
The news probably caused the spike a little and trigger some short squeeze fuelling the 300+ pts surge. Mentioned in previous post of testing the 3300 zone support then bouncing but didn’t expect it to shoot up so high 300+. Likely to cooldown after the news tampered down. Possible test of 3500 support zone and making a push for big channel top resistance around + horizontal resistance around 3720 zone.
News: (Current) https://cointelegraph.com/news/sec-commissioner-jackson-thinks-regulator-will-approve-btc-etf-leaked-interview-shows  | (Upcoming)
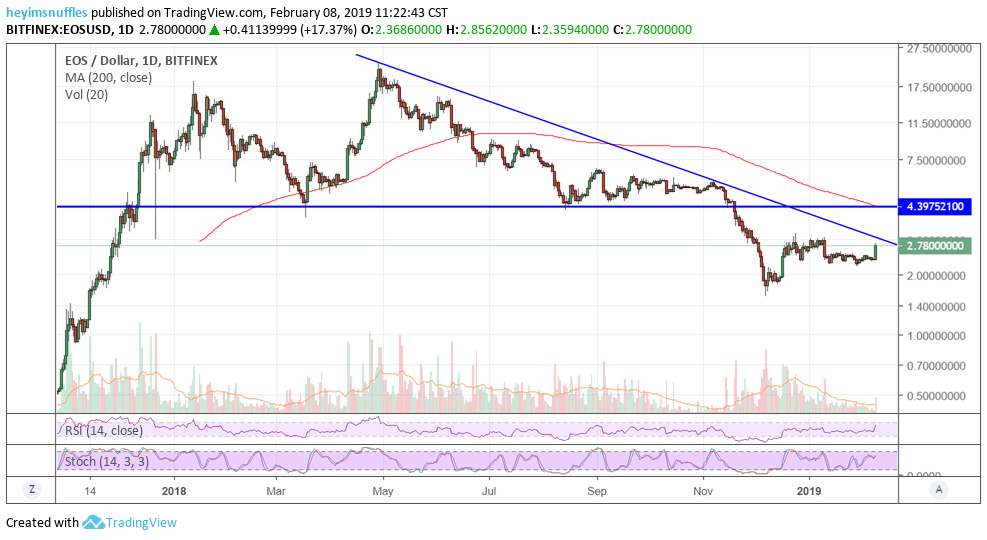
Short term moving average (day candle) :
RSI :
Network Value to Transactions Ratio :130
Total marketcap :120
Dominance :53
Bitfinex Margin Long/Short Volume Ratio :
Depth Chart : (S) | (R)
Weekly Timeframe

Dumb Mistakes Rental Property Investors Make

Often times we make things harder on ourselves than they should be.  This is no different in rental property investing when you do the mistakes listed below.
Dumb Mistakes Rental Property Investors Make

Forgetting that Rental Property Investing is a Business

It may be called investing, but make no mistake this is a business.  Rental properties offer many more ways to make money compared to just holding stocks.  However, they also require some work and care as opposed to just buying and holding.
For your rental property to be profitable you need to make sure that your rent is being collected and the property

Dumb Mistakes Rental Property Investors Make

Often times we make things harder on ourselves than they should be.  This is no different in rental property investing when you do the mistakes listed below.
Dumb Mistakes Rental Property Investors Make

Forgetting that Rental Property Investing is a Business

It may be called investing, but make no mistake this is a business.  Rental properties offer many more ways to make money compared to just holding stocks.  However, they also require some work and care as opposed to just buying and holding.
For your rental property to be profitable you need to make sure that your rent is being collected and the property

Crypto Rips Higher – $EOS Spikes 17%, $LTC 30%+

Crypto has awoken. About 2 hours ago after slowly creeping higher and higher, crypto has spiked. EOS and LTC are two that are really ripping higher as they have been the ones that have shown relative strength. Below is the chart of EOS and you can see, if this day holds, this may be quite the igniting bar to start a trend reversal higher in the intermediate term.

Believe me, there is A lot of work left to be done and this work will be done through TIME or PRICE. This is the first step and you can see that taking

Bitcoin, EOS, Ethereum and Ripple Analysis: BREAKOUT

Bitcoin has been consolidating within a falling wedge these past couple weeks. Today it broke out of that wedge with a nice increase in volume behind it. Volume is no where near where it needs to be for a sustainable bull run, but that’s not to say it can’t get there.

EOS broke above the known $2.45 resistance. The next major area of resistance is $3.00. If it can remain above at least $2.70 today, it could be a sign this bullish move has legs.

Ethereum bounced nicely off the known $100 phycological support. It’s currently trading around $118. The next major

Forex Price Action Baby, No Technicals or Fundamentals…Trade #4 – Sold EUR/CHF (2/8/19)

10,000 Ft View – 4 Hr Chart

Zooming In

This trade entry was yesterday. What I like about the set-up is the strong move away from the level (orange arrow) that took out all of the pivots indicated by the yellow circles.

But what I really like about the zone is all the three mini zones within the bigger demand zone. Thus, if price is going to breach the 4 hr demand zone to the downside, it’s not going to be easy.

This post is my personal opinion. I’m not a financial
advisor, this isn’t financial advise. Do your own

Forex Price Action Baby, No Technicals or Fundamentals…Trade #4 – Sold EUR/CHF (2/8/19)

10,000 Ft View – 4 Hr Chart

Zooming In

This trade entry was yesterday. What I like about the set-up is the strong move away from the level (orange arrow) that took out all of the pivots indicated by the yellow circles.
But what I really like about the zone is all the three mini zones within the bigger demand zone. Thus, if price is going to breach the 4 hr demand zone to the downside, it’s not going to be easy.

This post is my personal opinion. I’m not a financial
advisor, this isn’t financial advise. Do your own research before making
investment decisions.

Crypto Contest February 8: Ethereum

Ethereum (Kraken: ETHUSD) has broken out of the triangle pattern in the daily chart.

(Chart courtesy of Tradingview.com (log scale))
Elliott Wave Analysis
In Elliott Wave terms, Ether began a wave one advance on December 14, 2018. The red wave one (blue sub-waves i-ii-iii-iv-v) finished on January 5 this year, and the red wave two (blue sub-waves a-b-c) correction ended on February 6. If this wave count is correct, Ether should be heading next towards the January 5 peak in the red wave three.

(Chart courtesy of Tradingview.com (log scale))
Looking at the monthly chart, I believe Ether is currently in the red wave five.