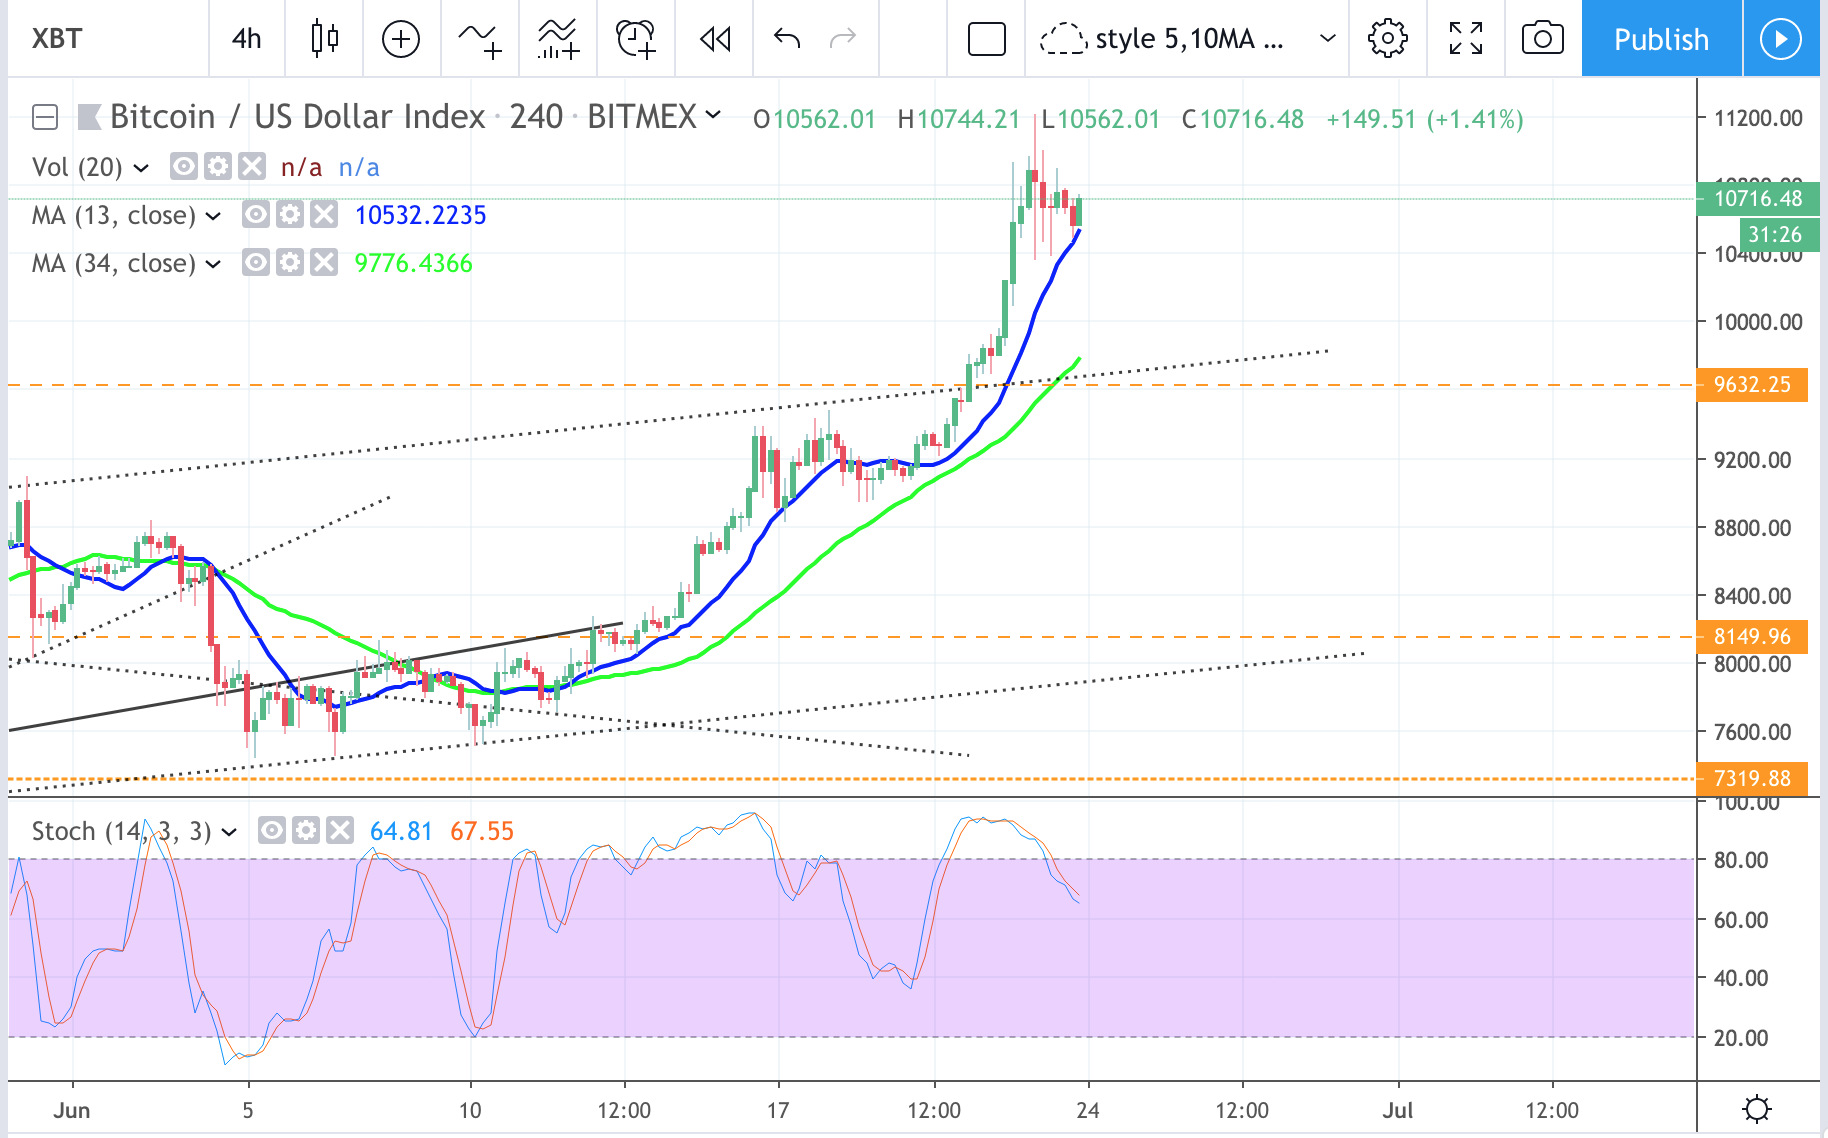
On 4hr chart, possible mini triangle consolidation before the breakout. Possible to still push higher for the weekly 11600 resistance zone before the pullback (can we see 30~40% down move ?) Weekly Ichimoku cloud piercing through the resistance. As mentioned in previous posts, LTC possible TD9 reversal next week which give about 4-5weeks more before the next estimated LTC halving in Aug.
News: (Current) | (Upcoming)
Short term moving average (day candle) :
RSI :
Network Value to Transactions Ratio :127
Total marketcap :325
Dominance :58.6
Bitfinex Margin Long/Short Volume Ratio :
Depth Chart : (S) | (R)
Weekly Timeframe :
Month: June 2019
Is this the one?? $GLD $GDX
Gold has broken up. For now the precious metal is leading the charge in futures. Usually this has not been the case in the past. The leader was always the more riskier asset of silver, or the gold miners. But, every time is different and usually will only rhyme. Gold and crypto are higher into the weekend and if this breakout is TRUE then we are in for a whirlwind of currency fluctuations.
The dollar is about to get smoked and the metals and crypto breakouts should explode. Sorry gold bugs, you will gain but the crypto wizards will gain
Cryptocurrency Relative Strength Analysis Report For Week Starting 6/23/19
When you think about Cryptocurrencies, one name immediately comes to mind, Bitcoin. Since the creation of Bitcoin, there has only ever been one cryptocurrency at the top of the market cap rankings…Bitcoin.
When the price of Bitcoin rises, generally you can expect altcoin prices to rise with it. Likewise, when the Bitcoin price drops, altcoins also follow. And sometimes when Bitcoin is rising, the altcoins are declining due to cash moving from the altcoins to Bitcoin and vice versa.
Source Image
Bitcoin dominance is used to measure the percentage of the cryptocurrency market that can be attributed to Bitcoin. Thus, it’s very easy
Crypto Contest June 23: BeeKan
BeeKan (Huobi: BKBTBTC) has broken out of the triangle pattern in the daily chart.
(Chart courtesy of Tradingview.com (log scale))
Elliott Wave Analysis
In Elliott Wave terms, BeeKan began a wave one advance on December 22, 2018. The red wave one (blue sub-waves i-ii-iii-iv-v) finished on March 21, 2019, and the red wave two (blue sub-waves a-b-c) correction ended on June 22. If this wave count is correct, BeeKan should be heading next towards the March 21 peak in the red wave three.
(Chart courtesy of Tradingview.com (log scale))
Funnymentals
Beenews is a value discovery platform for blockchain and digital currencies based on meta-graph chain (BKBT-Token).
(Sources: BeeKan)
How can I vote?
World Stock Market Relative Strength Analysis Report For Week Starting 6/23/19
The Standard & Poor’s 500 Index (known commonly as the S&P 500) is an index with 500 of the top companies in the U.S. Stocks. Because the S&P 500 Index represents approximately 80% of the total value of the U.S. stock market, it’s the bellwether index for the U.S. stock market. In addition, the U.S. stock market is the largest stock market in the world, it’s also the bellweather for equity markets around the world. The S&P 500 is arguably the most important stock market index on the planet.
Source Image
Because we live in a global economy, the global equity markets
Bitcoin on a Long-Term View – Deja Vu?
With bitcoin flying around again one likely wonders – where will it go next? Best way to get perspective on that is to sometimes take a step back in time. As in the time frame you are looking at to clear the noise and see some obvious price points.
We do this by looking at the weekly chart rather than the daily. Each candle represents a week’s worth of time and allows us to see a big picture and the levels where price reversed or bounced in the past over the course of a day or days.
Looking at the chart at
The Sunday Recap – Down the Rabbit Hole 34
BTC has decided to pump and so far seems inclined to continue to do so – no doubt re-igniting interest around the globe.
In other news a little known company – Facebook officially announced their small project ‘Libra.’ OK OK – a more honest by-line would be something along these lines – Global corporate titan announces phase two of worldwide financial and social domination with the support of like-minded corporate backers!
Personally, I see this as a win-win for Bitcoin. Libra’s success will greatly expand BTC’s profile as many hundreds of millions of folks suddenly find themselves contemplating this ‘crypto thing’. Were
BITCOIN – 22 Jun
On 4hr chart, tested 10k and break it easily. The low chance of testing the channel top and breakout happened though. New high at 11200, probably still some little room to go and test 11500 resistance, maybe a double top test before we get the real pullback correction.
News: (Current) | (Upcoming)
Short term moving average (day candle) :
RSI :
Network Value to Transactions Ratio :
Total marketcap :324
Dominance :58.5
Bitfinex Margin Long/Short Volume Ratio :
Depth Chart : (S) | (R)
Weekly Timeframe :
The FOMO is Real in Real Estate
Have you heard the term Fear of Missing Out (FOMO)? It has become a common term in all types of investing in recent years and rightfully so with most markets continuing to push higher.
What is it to FOMO?
When something is appreciating continuously – whether a stock, a home or even a trading card – people get wound up and scared they are missing out on the action. They are missing out of the chance to make some big bucks.
This leads people to chasing investments, such as overpaying for a home in a hot market because it “has to go up”
SPDR Sector Relative Strength Analysis Report For Week Starting 6/24/19
Sector rotation is the action of shifting investment assets from one sector to another to take advantage of cyclical trends in the overall economy in an attempt to beat the market. Sector rotation seeks to capitalize on the theory that not all sectors of the economy perform well at the same time because sectors of the stock market perform differently during the phases of the economic and market cycle.
For example, defensive sectors such as consumer staples, utility and health care stocks tend to outperform during a recessionary phase, while consumer discretionary and tech stocks tend to fare well during early