Forex Relative Strength Analysis Report For Week Starting 6/23/19

Some of the world’s
currencies are accepted for most international transactions. The most popular
currencies are accepted for most international transactions are the U.S.
dollar, the euro, and the yen. However, the U.S. dollar is the most popular.
And in the foreign exchange market 90 of forex trading involves the U.S.
dollar. Thus, when assessing the relative strength of the most popular
currencies in the world, it’s always against the U.S. dollar, using the daily
time frame chart.

The “major” forex
currency pairs are the major countries that are paired with the U.S. dollar
(the nicknames of the majors are in parenthesis).

AUD/USD – Australia dollar (Aussie) vs. the U.S. dollar

EUR/USD

Crypto Contest June 22: HyperSpace

HyperSpace (Bittrex: AMPUSD) has broken out of the triangle pattern in the weekly chart.

(Chart courtesy of Tradingview.com (log scale))

Elliott Wave Analysis

In Elliott Wave terms, HyperSpace began a wave one advance in November 2015. The red wave one (blue sub-waves i-ii-iii-iv-v) finished in January 2018, and the red wave two (blue sub-waves a-b-c) correction ended in November 2018. If this wave count is correct, HyperSpace should be heading next towards the January 2018 peak in the red wave three.

(Chart courtesy of Tradingview.com (log scale))

Funnymentals

HyperSpace offers community-owned spaces where members are rewarded for sharing content, and benefit from a daily allowance of AMP. You can

Is $11,500 the Next Stop for Bitcoin? Or is it Topping Out?

Just a Quick Update before I go to bed…I’m BEAT! I’ve read all your public and private messages on my various social sites. Thank you for the incredible support and love you’ve shown me. I apologize for not answering all your questions, but hope this video helps.

Video Analysis:

If you don’t see the above video, navigate to TIMM (https://mentormarket.io/workin/) or Steemit in order to watch.

I hope this has been helpful. I’d be happy to answer any questions in the comment section below. Until next time, wishing you safe and profitable trading.

Workin

If you found this post informative, please:

Get paid for viewing

Will Mike Novogratz Be Right This Time??? – Part 3

During an interview with CNN on May 9th, Mike Novogratz published on May 9 said that he believes that $6,000 is probably a stall point, and the next one will be $10,000. I wrote about his interview about a month ago and laid out some levels to monitor en route to $10,000.

NOTE: Mike is a former Goldman Sachs partner and now represents Wall Street’s transformation to the Crypto Space.

Will Mike Novogratz Be Right This Time???

And en route to $10K, price was making demand zone after demand zone and taking out supply zones after supply zone.Thus, the chart

Bitcoin $10000

I do not think that this post needs much of an introduction. You saw the lat bubble, I have seen the last 6 six. The talking heads said bitcoin was dead (for the 300th time) and it has now risen like Jesus Christ on Easter Sunday. They said it was going to $0, and we have crossed $10000, again.

$100,000 here we come. Don’t listen to the TV…the want viewers not gains.

Bitcoin Clocks 10K – Bulls Strong as Price Gets More Extended

There you have it folks, bitcoin just clocked 10k for this first time since March 2018.   Price has ripped higher today so enjoy the ride.  I would not be surprised to see some kind of reversal top in the next 24 to 48 hours.
I’m riding it for the meantime and may book a little if I see any kind of blow off top.

I’d say break out the champagne but we all remember what happened last time…..you know, we ripped to 20K.  Hahaha, keep your eyes open.  Don’t fomo and enjoy the profits if you have them.

MITH technical analysis

MITH seen from the temporality of 1D we can see that the price has reached the zone of demand, the bulls have to get to hold this position if we want to see a pullback to the parallel channel that was broken in the previous candle, the bulls have to push strongly the price to get to claim the support of the channel and thus be able to continue rising, if not to claim the support or if the demand in 1D is not enough to hold the position is very likely to see the price fall to 160.

MITH seen

Bitcoin Breaks Out…Eyeing $10,000!

Yesterday I discussed a likely breakout to $9,700-$9,800. Today bitcoin has exceeded those targets, climbing as high as $9,930. Daily volume has spiked from about $15 billion to over $20 billion.

In today’s video I discuss where price may be heading next, key areas to watch, traps to avoid and so much more. I hope you find it helpful.

Video Analysis:

If you don’t see the above video, navigate to TIMM (https://mentormarket.io/workin/) or Steemit in order to watch.

I hope this has been helpful. I’d be happy to answer any questions in the comment section below. Until next time, wishing you safe and profitable

Don’t Believe The Hype On Steel Stocks

The steel sector in the United State has experienced setbacks lately. The classic American steel producer,  United States Steel (X, NYSE), reported on June 19 that it will close two Midwestern blast furnaces. A few days earlier, its American counterparts, Nucor (NUE, NYSE) and Steel Dynamics (STLD, NASDAQ), released mediocre Q2 earnings forecasts, signifcantly lower than analysts’ expectations.From a yearly perspective, in 2019 steel stocks as a whole sank by 40% compared to 2018 mainly due to investors’ concerns that the growing trade war between the United States and China would cause global economic slowdown and would, consequently, lower demand

BITCOIN – 21 Jun

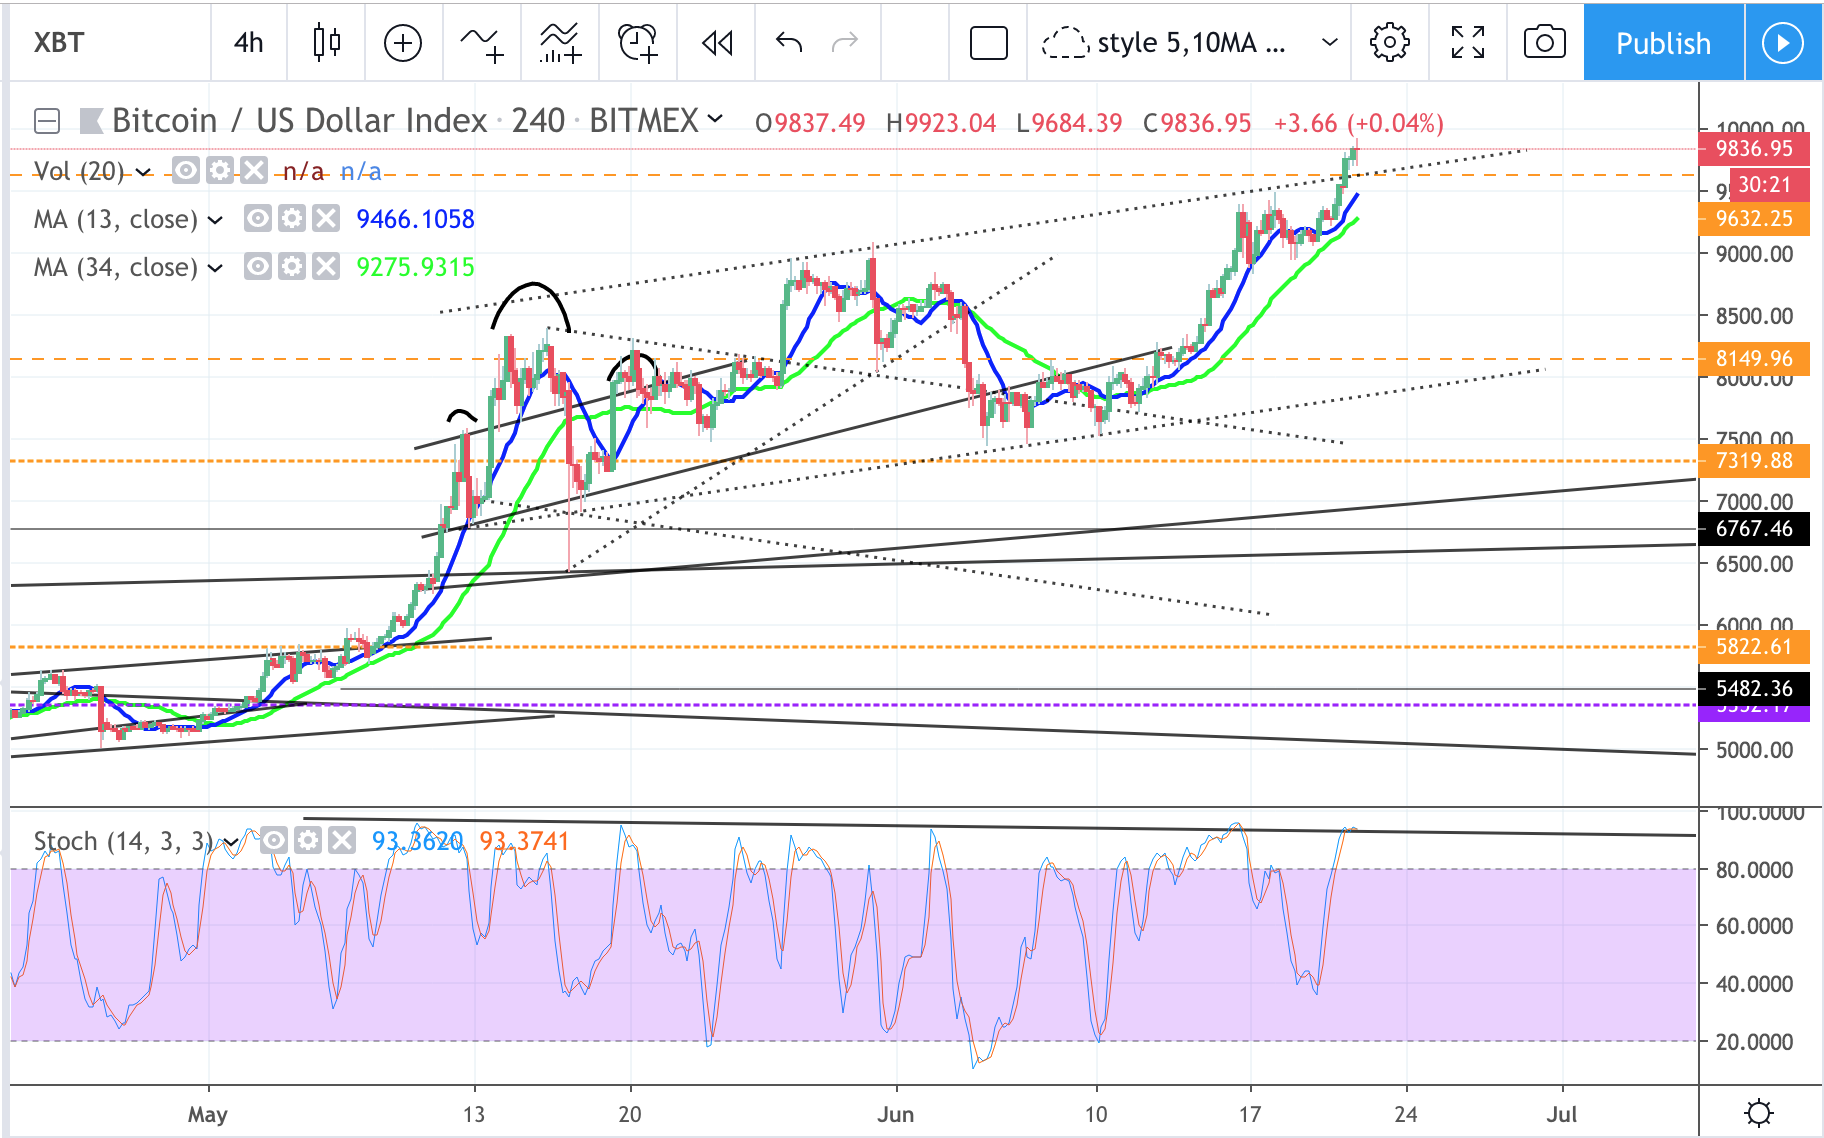
On 4hr chart, as mentioned in previous posts, it did hit 9600 and almost tested 10k mark. Possible to repeat the channel breakout like the previous round for the 3rd leg, low chance though. LTC halving around 5 Aug, possible TD 9 in 2 week time which is about into jul period and if history repeat, there’s pullback and sideway move before the next halving.
News: (Current) | (Upcoming)
Short term moving average (day candle) :
RSI :
Network Value to Transactions Ratio :122
Total marketcap :301
Dominance :58
Bitfinex Margin Long/Short Volume Ratio :
Depth Chart : (S) | (R)
Weekly Timeframe :