Mohawk Industries, not a household name, but Mohawk Industries is a leading global flooring manufacturer for remodeling and new constructions of residential and commercial markets. From carpet, rugs, ceramic tile, laminate, wood, stone and vinyl flooring, Mohawk supplies it. Its core brands include: American Olean, Daltile, Durkan, Karastan, Marazzi, Mohawk, Pergo, Unilin, Quick-Step and IVC.
Mohawk Industries Inc. reported their second-quarter earnings on Friday. They beat profit expectations, but missed on revenue. In addition, forecasted a dismal third quarter. The news was enough to send the stock down double digits making them the biggest decliner listed on the NYSE.
Mohawk CEO Jeffrey S. Lorberbaum said in a statement that “most markets we operate in remain soft, with pressure on volume and pricing, and we anticipate the environment to remain difficult.”
Lorberbaum said Mohawk is taking action to address the uncertain business environment, with plans to streamline operations, consolidate facilities, and take out higher-cost assets. “We are reducing overhead structures and controlling investments,” he said. “We are improving our administrative costs while investing in sales to support new products and enter new geographies.”
Three months ago, Google reported revenue of $36.3 billion, up 17% over the previous year. Google’s ad revenue consisted of 85% of that revenue or $30.7 billion which was up from $26.6 billion. The company said they remain focused and excited by significant growth opportunities across their other business. However, Wall Street didn’t want to hear that. They wanted to know why the ad revenue growth decelerated from 24% a year ago to 15%. I think what really pissed Wall Street off was Google didn’t have any real answer, so the they dropped the price big time.
This past week, Google reported their second quarter earnings. Revenue increased 19.3% year over year to $38.944 billion, accelerating from 16.7% growth in the first quarter, beating estimates by nearly $800 million. Net income for the quarter climbed to $9.947 billion, up nearly 21% year over year and ahead of expectations. Equally important, ad revenue rose 16.1% to $32.601 billion.
In the second quarter, annual paid click growth for Google properties continued slowing, dropping to 28% from a first-quarter level of 39%. But this was more than offset by the fact that CPC only fell 11% — a much smaller decline than 19% in the first quarter and also the smallest drop Google has seen in three years.
Porat mentioned on the call that “the benefits of applying machine learning” have boosted ad sales on Google properties, but didn’t offer additional details. In the past, Google has talked up its use of machine learning to help advertisers (including small businesses) optimize their ad campaigns based on goals such as maximizing ad clicks, sign-ups or revenue.
Price is back in monthly supply, but the chart suggests, potential all the unfilled sell orders have been used up and so Google has a shot of reaching all time new highs in the near future.
This post is my personal opinion. I’m not a financial advisor, this isn’t financial advise. Do your own research before making investment decisions.
Opportunity is a haughty goddess who wastes no time with those who are unprepared.
George S. Clason
No TA expertize is required to see that the short-term chart is clearly bearish. The general consensus seems to be a drop to 8.5k, filling the CME gap, or roughly 7.5k, resting on the 200 day EMA. Many analysts also point out the likelihood of the market front running this decline and therefore lessening it or an overshoot briefly dropping price well below the 200 EMA.
The majority of analysts see a quick rebound from these levels an analysis I myself share.
As a consequence, I have laddered buys on BTC at 8.8/8.6/8.4/7.8/7.6/7.4/7.2 and 6.8 (largest entry).
These are all small buys representing in total 30% of
my currently allocated new capital for BTC.
However, the majority of my investable capital remains side-lined and this is why.
Hunting the Outlier Opportunity
If BTC hasn’t in fact bottomed-out – a decline to 1.5k
is still in play.
Is this likely -no.
Is this off the table – no.
Why 1.5k – well this is simply a reference point – lower than the previous low of 3.1k is my point of focus.
Why Care?
A 1.5k BTC would constitute, in my opinion, an unlikely to be revisited entry point opportunity. No doubt should the price collapse to such levels the doomsayers will be legion – all is lost will be the dominant narrative and that narrative will be completely wrong.
Now do your own research here but from the multi-year research I’ve conducted, BTC would in no way be fundamentally undermined by a drop to sub 2k. Of course, some miners would shut up shop. The network’s hash power would almost certainly decline and steeply so. Nonetheless, the fundamental value proposition of BTC would remain undiminished.
So 2k or Nothing?
No.
In terms of my own portfolio – I have decided to
ladder in increasingly large positions at these levels
5.6k / 4.6k / 3.6k / 2.6k / 1.6k
None of these orders are yet on an exchange but should price break 7.5k then they will be placed.
These are all binary outcome positions – there is no stop-loss.
The investment horizon is 10 years or more.
Should price collapse to this area what I won’t be doing is looking to the mainstream media or Telegram or Twitter for guidance.
Bitcoin’s long-term price outlook depends on none of
those sources nor is it entirely bounded by the chart.
A new mechanism to store wealth offers an ROI of unknown magnitude and given its short trading history charts can only take you so far in analyzing BTC. For that, you need to be willing to assess/research the fundamentals of the project and draw your own conclusions once you’ve done so.
What About Missing the Boat?
Well, as I’ve been accumulating Bitcoin for the last 8 months – this isn’t relevant.
If you haven’t bought any BTC to date – waiting on 1.5k is a low probability outcome.
In addition, I purchase BTC every week – dollar-cost averaging greatly simplifies the process of accumulating BTC.
When Does this Outlier Hypothesis Become Irrelevant?
https://www.tradingview.com/x/WUEDfXSR/
An open and close above 13.8k on the weekly chart closes the book on this outlier proposition and would see me looking to enter capital on substantial dips into the 10k zone.
So This Guy is Saying BTC is Going to Fall to 1.5k?
No – not at all – this is an outlier proposition but one which is still worth planning for because:
A) It might offer an excellent accumulation opportunity.
B) If you haven’t entertained the idea that BTC may fall to this level – you are very likely to panic were it to do so. Panic is a terrible investment partner.
C) Focusing on lower-entry point outlier opportunities highlights the very real risk involved in investing in crypto.
Read This
It’s your money – you worked for it – it was hard to acquire – don’t let the greedy monkey inside your head convince you to ‘over-invest’ in BTC or any crypto. Take your time and research Bitcoin and the market in general before you deploy any capital Only after a period of learning, and reflection should you purchase crypto. Always remember – high risk is not a concept – there is a high percentage chance of you losing everything you invest.
As Bitcoin dropped an additional 8% on Saturday, naysayers claim the rally to a new all-time high is over. So what is it that’s keeping market analysts bullish in the face of a 33 percent correction?
Bitcoin price bears draw a line at $10,000
Bitcoin’s most recent price action has been less than satisfactory, unless you’re a bear. To date, the top digital asset is down 32% from it’s 2019 high of $13,739 and short term price action remains overwhelmingly bearish.
Over the past two weeks Bitcoin formed an M-top at $13,739 and $13,177 before dropping to the neckline around $9,600. Most traders expect that Bitcoin will retrace to the 61.8% and 50% Fibonacci Retracement level which is also near the CME futures gap. It’s possible that the group think surrounding the CME gap is causing it to function as a magnet, drawing BTC price nearer to the $8,500 – $7,500 range.
Dormant Bitcoin wallet address hit new all-time high
Earlier this week Coin Metrics released a report showing Bitcoin’s untouched supply reaching a new all-time high of 21%.
Not everyone supports this conclusion, however. Adamant Capital founding partner Tuur Demeester countered saying that: “I’m not so sure […] 5 years without updating your cold storage method is a long time in Bitcoin. Imo most of these coins are likely lost.”
Start of new bull markets coincides with miner capitulation, data shows
On Saturday expert crypto-analyst PlanB tweeted a rather intriguing chart that he and ParabolicTrav worked on.
According to the analysts, after a BTC/USD rally reaches its peak, a massive amount of Bitcoin is available at lower prices. The start of new Bitcoin bull markets have coincided with miner capitulation and Bitcoin price tends to rise from these bottoms to grow 100 times.
According to PlanB:
“We saw difficulty bottoms (miner capitulation) in Dec 2011 ($4.6), May 2015 ($230) and Dec 2018 ($3,896). Price continues to rise from these bottoms until ATH around 100x […] Implying a continuing uptrend until $370,000 ATH.”
In last week’s column — my third on Libra — I referred to a core dilemma confronting the cryptocurrency project’s financial inclusion goals: the impossibility of being both pro-privacy and pro-KYC.
I promise a break this week from Libra and its controversial founder, Facebook. But I want to dive deeper into that dilemma because the problem is hardly unique to that project. As “know-your-customer” rules have steadily encroached into their world, all cryptocurrency startups trying to expand financial access for the poor are hamstrung by requirements to identify and track the people they seek to serve.
This contradiction stems from tough policies contained under Anti-Money Laundering and Combating the Financing of Terrorism rules (AML-CFT), which were tightened worldwide after the September 11 attacks in 2001 and then again after the financial crisis. Since virtually every bank needs access to dollars, KYC rules everywhere tend to follow models laid down in the U.S. Bank Secrecy Act and in guidelines of the U.S. Financial Crimes Enforcement Network, or FinCEN.
Further internationalizing pressure comes from the inter-governmental Financial Action Task Force, or FATF, which sets the regulatory standards by which countries pressure each other to comply.
“It’s not a surprise to me that inevitably corporations are going after creating their own tokens but for Facebook to be one of the first big ones is is pretty much a surprise,” said Lukka CEO Jake Benson told us when news of Libra began to spread. The world shared his surprise when Facebook unveiled its wild cryptocurrency dreams last month. But that surprise quickly turned into concern and condemnation as politicians started thinking about what it meant for a company to run its own mint.
Facebook’s reaction to the hearings was also surprising. The usually-reticent social media giant sent their best fighter – Libra co-creator David Marcus – into the ring to defend the currency and the battle raged for two days as the U.S. Congress and Senate took turns bringing up their concerns.
The result? A stalemate… for now. token transactions.
Initial coin offering (ICO) consultant CoinLaunch has agreed to pay $50,000 to the Ontario Securities Commission (OSC), according to documents published on the regulator’s website dated July 24.
According to commercial litigator and former programmer Evan Thomas, CoinLaunch was consulted on two ICOs, BCZERO (raising funds for a Czech off-road truck racing team) and ECOREAL (raising funds for a Portuguese resort), both of which were found to be securities. CoinLaunch reportedly created the tokens, white papers and websites, advised on the sale structure and made introductions, including to crypto exchanges for listings.
According to Thomas, the OSC found that the service was an act in furtherance of the trade of the security tokens since it was instrumental to the solicitation of investors. The consultant agreed to pay a $50,000 fine under a settlement.
The hedge fund of famous investor Bill Miller saw 46% growth in the first half of 2019, reportedly in some part from investing in Bitcoin (BTC).
Citing an investor document, Bloomberg reports on July 26 that Miller achieved such outstanding results by investing in Bitcoin among other high-performing stocks. Alongside Bitcoin, other investments in the Miller’s fund reportedly include Amazon, security system firm ADT, as well as Avon Products.
The 69 year-old investor reportedly found success by following a similar investment strategy as he used during his three-decade run at Legg Mason, which envisions investing in securities that trade at a large discount to their intrinsic value.
“Cast your vote at 0x.org/vote to add support for ERC-1155 and the StaticCallAssetProxy!”
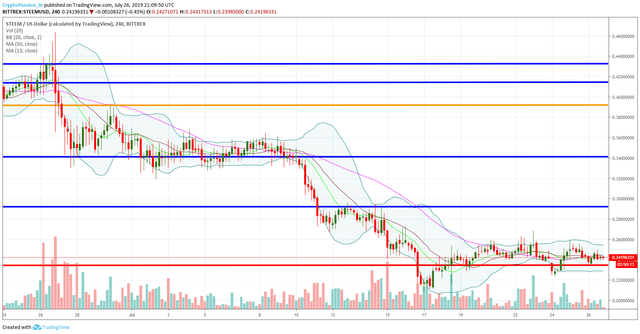
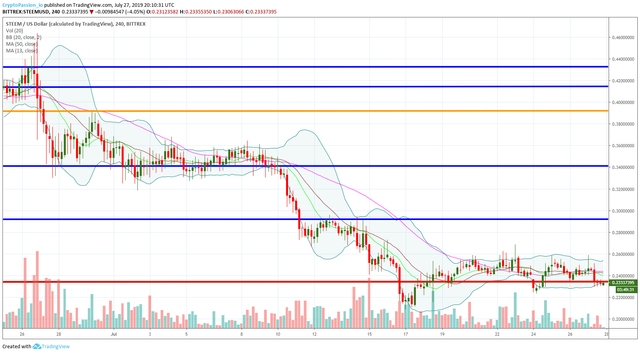
STEEM Trading Update by my friend @cryptopassion
Here is the chart of yersterday :
Here is the current chart :
The STEEM is still sitting on the support line at 0.24$, waiting for the next move from the BTC. I’m really afraid that the BTC will continue it’s correction so yeah, I’m little bit pessimist about that support line at 0.24$. However, I really wish that I’m wrong and that this support line will keep us upper but be very carefull in the coming hours.
In Elliott Wave terms, BWX began a wave one advance on July 22. The red wave one (blue sub-waves i-ii-iii-iv-v) finished on July 23, and the red wave two (blue sub-waves a-b-c) correction ended on July 27. If this wave count is correct, BWX should be heading next towards the July 23 peak in the red wave three.
Align Technology, Inc. designs, manufactures, and markets a system of clear aligner therapy, intraoral scanners, and computer-aided design and computer-aided manufacturing (CAD/CAM) digital services. Align Technology is famous for making the Invisalign.
Nine months ago, the stock crashed 25% due to lower average selling prices for the Invisalign clear aligners as a result of the company running promotional programs during the third quarter that included discounts for its clear aligners and product mix changes. The CEO said the promotional programs are temporary, so the current issue seems to be temporary. Nevertheless the stock fell from all-time highs.
This past week, Align Technology announced their second quarter earnings. Despite strong growth in Europe and Brazil, the stock fell big time again.
On top of reporting an earnings miss in the quarter, Align shipped 377,100 of its core Invisalign cases which fell 5,800 units short of expectations. Hogan told CNBC’s Jim Cramer Thursday much of the weakness can be attributed to China.
China is Invisalign’s second largest market and the company hoped to see 70% growth in the second quarter, the CEO told Cramer. But Thursday’s report showed just 20%-30% growth and the weakness is not due to any competitive or operational issues.
“It’s just basically a consumer backlash right now, we feel, from a standpoint of making decisions on going ahead with aligners or not,” Hogan said.
When I look at the daily chart of bitcoin and I see the price action of the past couple months, then I look at the 2017/2018 top and think….”wow, that look’s a bit similar.”
Will Lightning Strike Twice – Probably Not
Here’s the thing. Even though the chart doesn’t look great I also don’t see how we crash the way we did a year and a half ago.
The same ingredients do not exist. The move has not been crazy, the general mom and pop is not talking about bitcoin at your local diner and there isn’t a ICO shit coin craze.
Where can we go though?
We can certainly go down a bit still. If you look at the chart, basically it has made an “h” looking pattern which leads to lower prices many times. That’s just odds though, doesn’t mean it will happen.
A move down to 8,500 and evan 7,500 would still be ok on a technical basis. I wouldn’t consider that bearish as 7500 is a clear bottom when looking at a weekly chart. As long as it tested and rallied off that I’d still be bullish.
Let’s hope we don’t have to even play it out.
On the upside, getting above 9,800 and pushing toward the 11k mark is the bullish price action we need.
I honestly believe it’s anyone’s guess which way the next near-term move is.
I’m keeping some fresh powder available in case we do get an opportunity to buy lower…otherwise hodl’ing my bag.
I hope this has been helpful. I’d be happy to answer any questions in the comment section below. Until next time, wishing you safe and profitable trading.
Workin
If you found this post informative, please:
Get paid for viewing ads and Support the Crypto Ecosystem with Brave Browser. Free download here: https://brave.com/wor485
When you think about Cryptocurrencies, one name immediately comes to mind, Bitcoin. Since the creation of Bitcoin, there has only ever been one cryptocurrency at the top of the market cap rankings…Bitcoin.
When the price of Bitcoin rises, generally you can expect altcoin prices to rise with it. Likewise, when the Bitcoin price drops, altcoins also follow. And sometimes when Bitcoin is rising, the altcoins are declining due to cash moving from the altcoins to Bitcoin and vice versa.
Bitcoin dominance is used to measure the percentage of the cryptocurrency market that can be attributed to Bitcoin. Thus, it’s very easy to determine the relative strength of Bitcoin at any point. Not the case for the altcoins…until now. I have taken the more popular altcoins and determined their relative strength, relative to Bitcoin using just moving average.
Binance
EOS
Ethereum
Litecoin
Neo
Steem
Tron
Zcash
Based on the moving averages and the last daily closing price, relative to the moving averages,
the altcoins relative strength, relative to Bitcoin are the following:
Two Weeks Ago
This post is my personal opinion. I’m not a financial advisor, this isn’t financial advise. Do your own research before making investment decisions.
As the oil major BPis expanding its footprint in EV charging, the company has stated it is focusing on reducing charging times, “…to have a battery in a car by 2021 that can be charged completely in five minutes – for a lot more than 100 kilometers”.
After its acquisition of BP Chargemaster for US$170m, BP is now in the process of installingultra-fast EV chargers at service station in China, Germany, and the UK.
BP is also investing in biofuel development, as it considers the technology to be “the best way of decarbonizing long-distance jet transport”.
Analysis and Comments
This level of super fast charging is the holy grail of EVs. As cost comes down, and as the charging network grows, the last big barrier to overcome is the inconvenience of the time it takes to charge.
This shift, if achieved, could open up the EV market to those city dwellers who don’t have off street parking (so no easy home charging option).
To be clear, the BP target is just that; a target. The article claims, that the technology from a BP investment in an Israeli company called StoreDotalready allows ultra high speed charging of mobile phones but the EV version seems to be work in progress.
The technology (FlashBatteries) seems to be a combination of the use of organic compounds in the cathode (plus Silicon?) and some form of capacitor technology (those of you with good memories will recall that Tesla recently purchased Maxwell Technologies – a global leader in ultra and super capacitors).
Normally, I would be sceptical about such claims – the “we have found a way of producing super batteries” story appears on a regular basis in the tradepress. But with BP money behind them, perhaps this approach has a future.