Ripple – we need to talk

I’ve often said that I don’t like Ripple, which is an understatement. But people have their biases and for all you know I might not have a legitimate reason for feeling that way. I need to tell you why I don’t like Ripple. I need to warn you about the wolf in sheep’s clothing. We need to talk.

Perhaps I should have written this long ago, but it just never seemed like a priority before now. Recent events have changed that, making it high time that I write this blog post. You need to read it if you are not clued
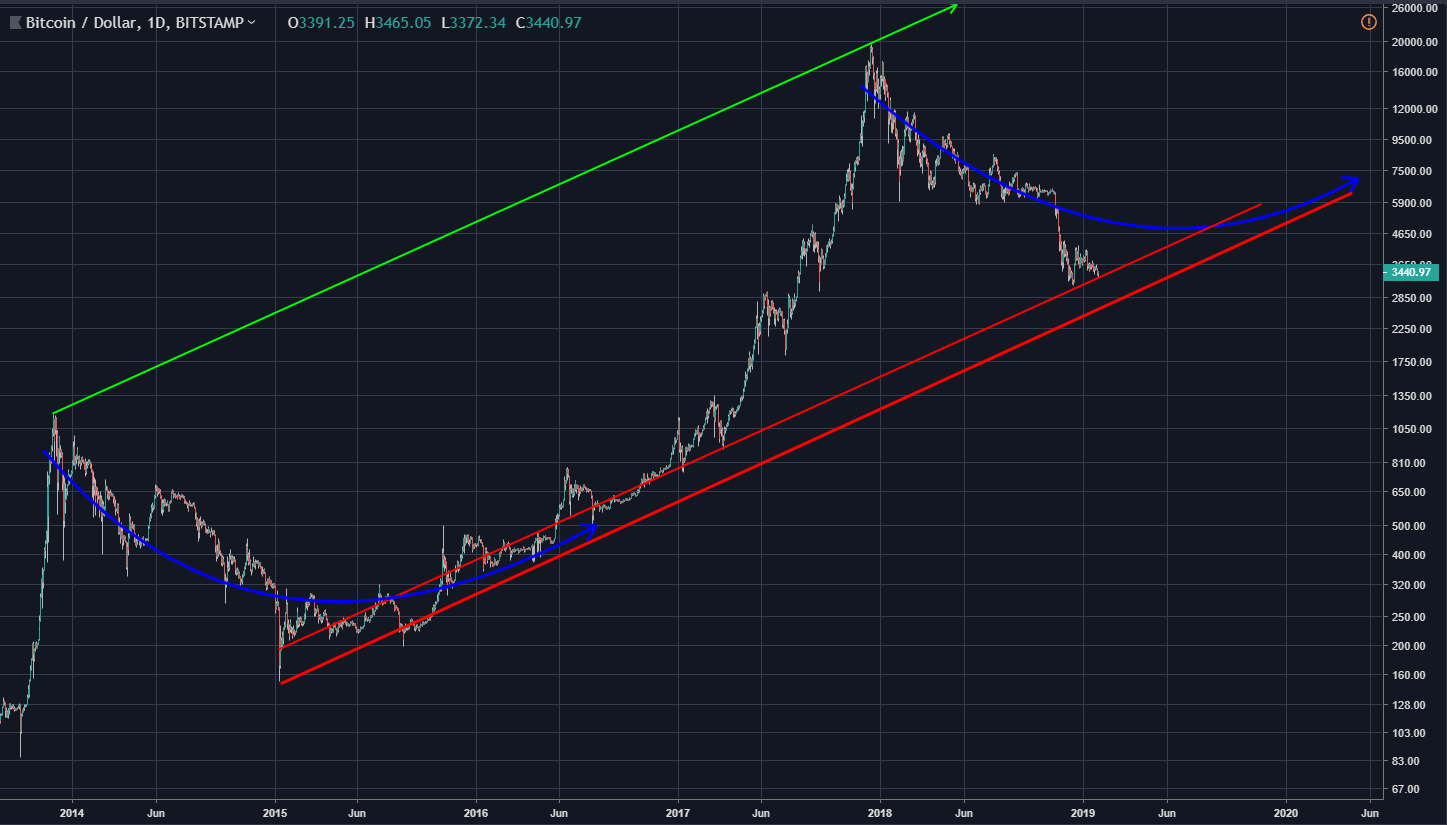
Bitcoin Long-term (31 Jan)

I’ve been promising an update to the long-term BTC chart since my BTC post of 10 January. Here it is.

The last time that I did a proper long-term look at BTC was when I looked tried matching the Fib levels of the 2014 bear market with those of the 2018 bear market, about 2.5 months ago.

For what it’s worth i think that I did a fairly decent job in that post, concluding that:

– $6069 may be a realistic post-capitulation consolidation level .– $3230 is a possible bottom for the 2018 bear market.– $3206 is also a possible bottom for

Technical Analysis for Bitcoin, EOS, ETH and XRP: BRIEF OVERVIEW

Bitcoin has broken back below $3,400 (Coinbase).

EOS is hovering around $2.27 (Bitfinex) and seems to be eyeing the $2.11 support.

Ethereum is sitting on the $100 phycological support. If that support breaks decisively, we could see it fall as low as $80.

Ripple (XRP) looks to be operating within a descending wedge. While this is a bullish pattern, it may get worse before it gets better.

In today’s video analysis I discuss, traps to avoid, where prices may be heading next and so much more. I hope you find it helpful.
Video Analysis:

 
If you don’t see the above video, navigate to TIMM (https://mentormarket.io/workin/) or

Bitcoin ventriloquism

Oh how Jamie Dimon makes me smile! It seems that he is now attempting to play the role of “Puppet Master”, in a rather obvious fashion.

For a man who states:

“I could care less about Bitcoin”~ https://www.youtube.com/watch?v=40OuVyVGdIM

it seems strange that he just can’t shut up about it.

Today I’ve been inspired by the article “Bitcoin Could Fall Below $1,260 if the Bear Market Continues: JP Morgan Analysts”, which sounds like typical anti-Bitcoin propaganda fresh from the mouth of Dimon himself; only it isn’t.

Instead he has his minions saying his words for him – his puppet employees at JP Morgan.

Let’s look at some of the Dimon-like quotes from the article and I’ll

Technical Analysis for Bitcoin: Quick Update

Bitcoin finally broke down below the $3,500 support it’s been hovering on for the last 2 weeks. It dropped to the known $3,400 support and is currently trading around $3,430.

Looking at the daily chart we can see bitcoin bounced right off the bottom Bollinger band.

In today’s video analysis I discuss, where price maybe heading next, traps to avoid and so much more. I hope you find it helpful.
Video Analysis:


If you don’t see the above video, navigate to TIMM (https://mentormarket.io/workin/) or Steemit in order to watch.

I hope this has been helpful. I’d be happy to answer any questions in the comment

BITCOIN: Bullish Divergence at the 4h-chart

Another low today, as expected, within the two lines which define the Bull-flag.

BITCOIN touched the lower support of the Bull flag and have entered inside the “Oversold” area of the RSI at the 4h-chart.

The good new is that RSI indication of the last two lows shows a divergence. When prices make lower lows but the oscillator(MACD or RSI are good ones) make higher lows it means just one thing, Next move must be upwards or, better said, it is a Bullish Divergence.

RSI Oscillator

MACD Oscillator

If you enter now (3400 USD), always considering that the upper dashed line is the “resistance” ,

BTC 29 Jan – still on track

This is a short update to explain the price movements of today in terms of yesterday’s prediction.

In the post “BTC update” yesterday I explained that BTC was both in a channel (forming a bull flag) and a converging triangle (signalling a breakout) as shown below:

From https://mentormarket.io/bitbrain/btc-update/

The triangle has now broken out – with some noteworthy results.

Made by Bit Brain with TradingView

The triangle broke downwards:This was obviously not the positive breakout from the channel as I had hoped it might be.The price dip to a new 2019 low of approx $3380 did not break through the bottom of the channel: The channel remains intact and that the bull flag scenario is still in play.While still remaining in the channel, the probability that

BITCOIN: another possibility…

With such a tiny volume is being really difficult to find any indication that show us the next move of BITCOIN and so, the direction of the Market.

The positive view now is that BITCOIN is still within the correction of a first wave within an upwards cycle…hopefully.

BITCOIN may be forming just a long Bull-flag, ending the wave 2 as I show you below:

Breakage of this Bull-flag upwards could be on (d) or after rebounding on (e)…

The upper Dashed line is marking the limit… we have to pay attention to that line because it is very likely that BTC has already

BTC update

This post is based on my last BTC post of 24 Jan

In that post I discarded my previous converging triangle and proposed that BTC was forming a bull flag.

Looking at the recent developments of the last week, I have a modification to that theory:

BTC once again appears to be forming a converging triangle. It has not yet broken out of the channel I described in my previous post and is thus still forming the bull flag. Shown below is the chart I used in my previous post:

From https://mentormarket.io/bitbrain/btc-24-jan-a-change-of-direction/

BTC remains range bound, so the bull flag remains in play for now.

Bitcoin: What a Snooze Fest

Been awhile since I posted about Bitcoin and with reason.  Price has been flatlined of late as we just muddle along in the middle of a range.
Range Bound and Hopefully Not Down
Until we see upside above about 4,200 there really isn’t much to talk about on the upside.   Looking at the chart below you can see we kind of flattened out at the bottom part of the last little move higher and are just riding right on the edge of it.
Hopefully this price level maintains otherwise we are likely to test that low near 3,100.

Guess we have to just wait