STEEM Price Touched Our First Price Target – What Next?

Okay, if you have read listened to my price analysis of steem on the scaredy cat investor show over on MSPWaves, then you know the price points we were looking for on steem.
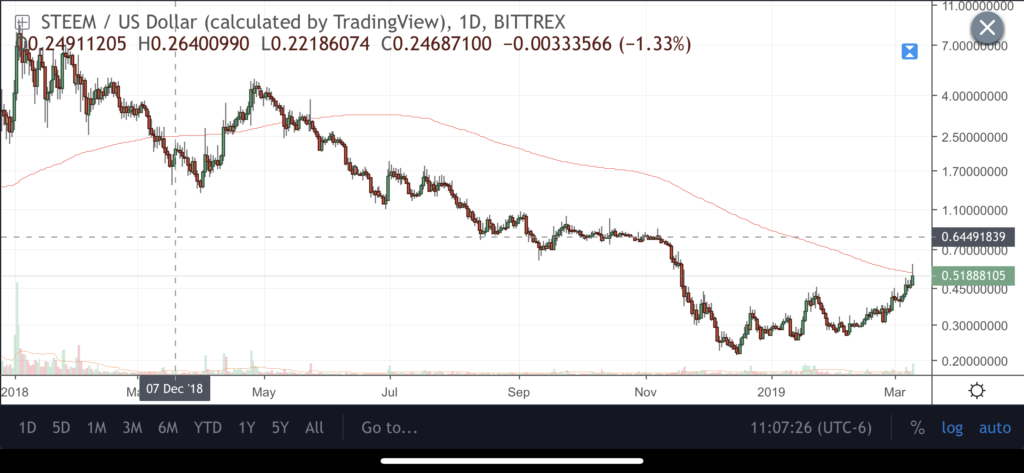
Steem once again charted well technically and we surpassed the first resistance at the 40-45 cent area to touch the first upside target.
Rebound Off The Target
I’ve noticed that when steem makes a push higher it tends to have that big upper wick bounce off the next upside target.  We are seeing it today so far.

Looking at the chart you can see we finally busted out of the lower
BITCOIN – 10 Mar

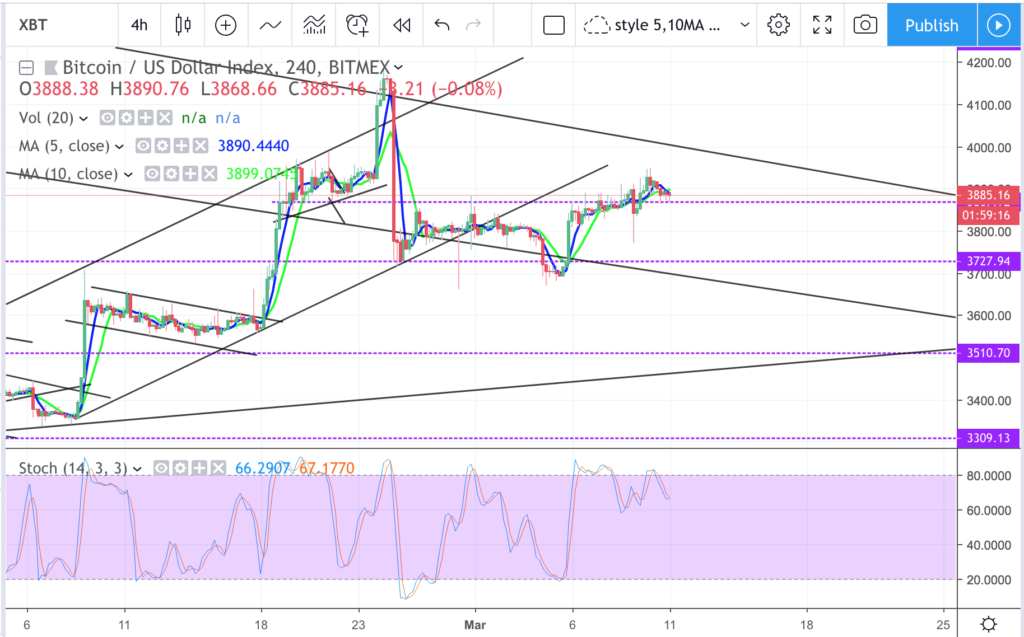
On 4hr chart, it did went higher to test near 4000 but tampered down. Possible to still try again for 4000 zone while consolidating around 3870 zone
News: (Current) | (Upcoming)
Short term moving average (day candle) :
RSI :
Network Value to Transactions Ratio :118
Total marketcap :134
Dominance :51.5
Bitfinex Margin Long/Short Volume Ratio :
Depth Chart : (S) | (R)
Weekly Timeframe :

Steem Test First Level of Resistance of Many, the big one

Steem spikes to above 0.55 overnight and is presently finding trouble at the declining 200 day MA. This is the first large level of resistance after the grind and spike and is very important. Assets do not trend higher if the 200 day MA is declining. That is simple logic.

If Steem can get over this line in the sand we will be testing the MAJOR BREAKDOWN ZONE OF 0.80ish. This is where the fun starts. If Steem and many other crypto’s can get above the major capitulation zones then we have a new bull market commencing.

Very constructive action

Crypto Contest March 10: QASH

QASH (Bitfinex: QSHUSD) has broken out of the triangle pattern in the weekly chart.

(Chart courtesy of Tradingview.com (log scale))

Elliott Wave Analysis

In Elliott Wave terms, QASH began a wave one advance in November 2017. The red wave one (blue sub-waves i-ii-iii-iv-v) finished in January 2018, and the red wave two (blue sub-waves a-b-c) correction ended in February this year. If this wave count is correct, QASH should be heading next towards the January 2018 peak in the red wave three.

(Chart courtesy of Tradingview.com (log scale))

Funnymentals

QASH is the native token of the Liquid trading platform. You can view their February AMA below.

(Sources:

The Sunday Recap – Down the Rabbit Hole 19

​This week I’d like to focus on the Twitter section of the Sunday Recap. My guess is that this part of the post is often overlooked as readers seek out weightier material. While Twitter is indeed full of fluff, the Tweets found here are intended to broaden and or challenge the assumptions of the reader. Have a look, you might be pleasantly surprised by what you find.

Pick of the Week

Ari Paul’s ten part reflection on lending your Bitcoin for interest – you might need to re-assess BlockFi’s 6% offer: https://twitter.com/AriDavidPaul/status/1103434043977330688

Twitter

The skillset required to understand crypto is broad:

Most educated people fail to

BITCOIN – 9 Mar

Seem like its trying so hard to push higher. Seem like there some price support around 3770 as one of the candle selloff and quickly got push back up. Despite it making higher highs on the price, stoch doesn’t support it. Likely to force push for 4000 zone testing the triangle top maybe spikes fake breakout shadow (making like a double top) before selling off again back into the triangle.
News: (Current) | (Upcoming)
Short term moving average (day candle) :
RSI :
Network Value to Transactions Ratio :118
Total marketcap :134
Dominance :51.6
Bitfinex Margin Long/Short Volume Ratio :
Depth Chart : (S) | (R)
Weekly Timeframe :

A Bounce is not just a bounce

BTC took a big dip less than a day ago. Unlike other recent dips, it didn’t stay there for long…

The recent BTC dip was significant in size: A drop from around $3894 to $3742 (a $152 difference – BitMex prices) within an hour is a relatively major drop. On any other day, a 3.9% drop in BTC price would be a considered a bad day. This day was different.

Whereas the norm for BTC is to stay at the new level after a sudden price drop or rise, BTC started recovering instantly: regaining and then passing the starting level (of the

A Break Above $4 and a new BULL may have began… $EOS

Litecoin has already done it folks, could EOS be next. I am watching the two horizontal lines as support as these NEED to hold, but above I am watching the $4 level. This is the 200 day MA. Price must cross this (obviously) for the 200 day MA to start trending back up…and once this happen a new bull has begun.

EOS is one of the cryptos that I like the must and I will likely be accumulating this into and up too the $8 range. Rising 200 day MA usually show strength and factual evidence that the asset is

BITCOIN: Volume is rising

Yeah! the market is experimenting a substantial increase on the Trading volume. The value today, more than 11 Billion USD, is similar to the values played by the end of December 2017 and, in my opinion, this is good, very good!

After having passed one year with an average
of less than 5B USD, since mid of February the trading volume has had a
clear increase trend and we are now in the values we all want to see.

Additionally, it is obvious for any TA analyst and Pattern Recognizing user that we are entering in another interesting area which would clarify

Crypto Contest March 9: Status Report XXVI

In this report I will look how my analysis worked for the month of January 2019. There were 31 contests in January. I have already paid out all of them. The analysis was correct three times. The analysis was wrong six times. The cryptocurrency was in a range 22 times.

The correct ones were the following:

Crypto Contest January 4: Byteball BytesCrypto Contest January 14: AgrelloCrypto Contest January 15: VIBE

In these contests the range option won:

Crypto Contest January 1: NeosCoinCrypto Contest January 2: ArbidexCrypto Contest January 3: EOSCrypto Contest January 5: Loom NetworkCrypto Contest January 6: Status Report XXIVCrypto Contest January 7: