BITCOIN: Triangular formation…

Remember my post yesterday and my main Two Possibilities … Should I reconsider those scenarios ? Well, you have always to review and control the Plan, however, I have to say that both possibilities are still valid but one is taking more chances to be correct…

Today, BITCOIN has been drawing a nice Triangular Pattern, One spike up (b), another one down, repeating the same level…(a), (c).

Currently another green candle seems defining the (d)…

Breakage of the triangle usually happens on (e) but it can also happen on (d) as well so, we have to pay attention to the action of Bitcoin

Where Are We in the US Market Cycle?

The US Market endured one of the worst holiday seasons of all time this past Q4. Since then we have rallied HEAVILY off the lows and in fact, “one of the best starts in stock market history by the Russell 2000” has happened.
Well you remember what happened in 2016, with the worst start to the year? It may be about to turn into the exact opposite.

Above you will see where I believe we are in the cycle. After rising so STEEPLY, and possibly topping, you get the initial down move. Then you get “THE BOUNCE”. We are coming up on

Crypto Contest January 17: Augur

Augur (Bittrex: REPUSD) has broken out of the triangle pattern in the weekly chart.

(Chart courtesy of Tradingview.com (log scale))
Elliott Wave Analysis
In Elliott Wave terms, Augur began a wave one advance in December 2016. The red wave one (blue sub-waves i-ii-iii-iv-v) finished in January 2018, and the red wave two (blue sub-waves a-b-c) correction ended in December 2018.  If this wave count is correct, Augur should be heading next towards the January 2018 peak in the red wave three.

(Chart courtesy of Tradingview.com (log scale))
Funnymentals
Augur is a decentralized oracle and peer to peer protocol for prediction markets. Veil, a peer-to-peer trading platform built on Augur,

Get. On. The. Blockchain. Rocketship.

It is such a good thing for the ecosystem and crypto itself that bitcoin an cryptocurrencies are not in the news every hour of every day like they were in 2017. This makes it so much easier for the blockchain believers to concentrate and help evolve the technology, rather than constantly hear from people gambling and tweet hating everywhere about crypto. It is actually pleasant. It is possible that the crypto stars are beginning to align again.

First off, bitcoin is not technically broken until it goes under 1150. This is quite crazy but you can see in the past bubbles

BITCOIN: Current Possibilities

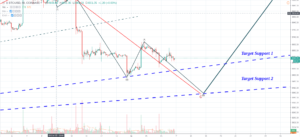
Two Target supports, two different alternatives…

Assumption: Extended 5th still on going

Last 5th wave of the down-cycle may be composed by 5 subwaves (Brown). First wave (very long IMO) and 2nd wave completed… 3rd wave on going…

Target limit 3375 USD (Target support 2)

Assumption: 5th wave completed

1st wave (brown) up completed, building the 2nd… If BTC rebounds on the “Target support 1” around 3537 USD then the EW count is valid and the 3rd wave upwards will be formed…

Entry Target: 3540 after rebounding on the support 1.

@toofasteddie

*Disclaimer: This is just my personal point of view, please, do your own assessment and act consequently. Neither this

What happens after the bounce is what matters!

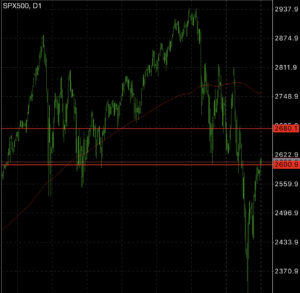
Well folks, we are now here. On Christmas Eve I said we are bouncing, followed by what happens after the bounce is what matters going forward. This V shape bounce (somewhat surprising how quick) has now ran into some HUGE sellers at 2610 and 2680.

If you go back and read my previous posts, these two levels have been mentioned over, and over, and over again, and again, and again. By drawing the resistance line you can literally see the wall that has been created from past prices. There is a 90% chance this causes trouble, the other 10% is a

Crypto Contest January 16: NoLimitCoin

NoLimitCoin (Bittrex: NLC2BTC) has broken out of the triangle pattern in the daily chart.

(Chart courtesy of Tradingview.com (log scale))
Elliott Wave Analysis
In Elliott Wave terms, NoLimitCoin began a wave one advance on November 23, 2018. The red wave one finished on December 3, 2018, and the red wave two correction ended on December 7, 2018. The red wave three  (blue sub-waves i-ii-iii-iv-v) advance finished on December 27, 2018, and the red wave four (blue sub-waves a-b-c) correction ended on January 13 this year. If this wave count is correct, NoLimitCoin should be heading next towards the December 27, 2018 peak in the red wave five.

(Chart

BITCOIN: Two possibilities, same result…

As explained yesterday… currently there are a lot of chances that the end of the correction has not been reached, and so, there may be a last move downwards in order to terminate the 5th wave down.

BITCOIN is now approaching the first target support on which I would expect some hesitance but, in order to complete the 5th wave down, I think there is a high likelihood of reaching a lower price than the one reached by the 3rd wave.

Using FIBONACCI Levels, right now BTC is touching the 61.8% of total retracement but, as you can see, does not seem

Crypto Contest January 15: VIBE

VIBE (Binance: VIBEBTC) has broken out of the triangle pattern in the daily chart.

(Chart courtesy of Tradingview.com (log scale))
Elliott Wave Analysis
In Elliott Wave terms, VIBE began a wave one advance on September 12, 2018. The red wave one (blue sub-waves i-ii-iii-iv-v) finished on September 22, 2018, and the red wave two (blue sub-waves a-b-c) correction ended on December 14, 2018. If this wave count is correct, VIBE should be heading next towards the September 22, 2018 peak in the red wave three.

(Chart courtesy of Tradingview.com (log scale))
Funnymentals
VIBEHub is a virtual and augmented reality metaworld that specializes in using volumetric video

If the Aussie Bottoms, so do Commodities…

I have been lurking and hunting for the commodity bottom for the past 3 years. Every single small rally has been sold and we truly are in uncharted waters regarding how pressed down the commodity market has been recently. Commodities are one of the largest impacts to the Australian economy seeing as it has an abundance of natural resources on the continent. Therefore the Aussie dollar wants to see commodity prices increase. Check out how oversold the commodity market is…

And then look what happened after each of these signals. I am not sure if the time is now, seeing as