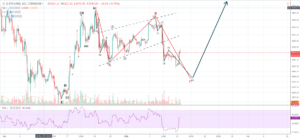
BITCOIN: Is the correction finished?

…and the answer is also difficult.

I see two possibilities now at the 4 hour-chart.

The first one: with the last drop, BITCOIN has reached the 5th wave bottom, end of the ZIG-ZAG correction…

3rd wave longer than 1st and 5th… 5th wave short but within the expectations, since “C” is just below “A” Leg… From now on, we should see 5 waves towards the “Target Resistance” in dashed Blue line.

If BTC manages to break that resistance it would be a very good signal of Reversal…

2nd Option (among others, of course…): The assumption would be that still the 4th wave is in play

Bitcoin Technical Analysis: PRICES SPIKE, BUT DON’T GET COMFORTABLE YET

Bitcoin’s price spiked from a low of $3,480 to $3,700. It’s currently trading around $3,670 on Coinbase. We know $3,600 was acting as a strong support before prices dropped 2 days ago. Often when a support is broken, it starts acting as resistance. In this case, when price spiked, $3,600 did not act as resistance. This gives bulls some hope for a larger rally. Let’s now see if $3,600 starts acting as support again.

This latest rise in price also came with a drop in long positions. In other words, traders to profit. This is a healthy sign.

Unfortunately, overall daily volume

Crypto Contest January 14: Agrello

Agrello (Binance: DLTETH) has broken out of the triangle pattern in the daily chart.

(Chart courtesy of Tradingview.com (log scale))
Elliott Wave Analysis
In Elliott Wave terms, Agrello began a wave one advance on August 16, 2018. The red wave one (blue sub-waves i-ii-iii-iv-v) finished on October 30, 2018, and the red wave two (blue sub-waves a-b-c) correction ended on December 29, 2018. If this wave count is correct, Agrello should be heading next towards the October 30, 2018 peak in the red wave three.

(Chart courtesy of Tradingview.com (log scale))
Funnymentals
The Agrello platform is a dashboard where you can manage your identity, create contracts,

BITCOIN: Testing and old resistance

Early yesterday we saw a sudden drop of the BITCOIN price followed by a short and shy consolidation movement upwards…

The drop was expected since the Elliot Wave count was alerting about that in order to complete a long 5-3-5 Correction…

The question is, does the drop terminated? It may have been terminated, actually it looks like a very short but probable 5th wave…

In order to know it we have to see how BITCOIN manage in front of the next resistance:

The RSI indicates oversold condition but the Constant Low Volume does not bode high hopes for recovery…

My plan keeps alive, for the

@Steemit is Powering Down…Everything…Longterm GREAT THING $STEEM #crypto

Well folks, I believe the time of Make it or Break It may not be upon us in the Steem ecosystem. @Steemit has decided to start its’ power down of 34 Million Steem Power as you can see below.

They then send a memo to say they are moving the Steem to “secure wallets”. I call absolute bullshit on this reasoning. They are powering down to pay for the company and expenses, and likely also for some more research and expenditures. I presently have some mixed feelings about this situation…
Normally when The Majority stake holder starts selling LARGE amounts (it is

Crypto Contest January 13: Unikoin Gold

Unikoin Gold (Bittrex: UKGBTC) has broken out of the triangle pattern in the daily chart.

(Chart courtesy of Tradingview.com (log scale))
Elliott Wave Analysis
In Elliott Wave terms, Unikoin Gold began a wave one advance on October 15, 2018. The red wave one (blue sub-waves i-ii-iii-iv-v) finished on November 6, 2018, and the red wave two (blue sub-waves a-b-c) correction ended on January 1 this year. If this wave count is correct, Unikoin Gold should be heading next towards the November 6, 2018 peak in the red wave three.

(Chart courtesy of Tradingview.com (log scale))
Funnymentals
Unikoin Gold is a decentralized esports betting token. Crypto Cowboys interviewed the

$SPX Weekly Outlook: Neutral Bearish $QQQ $IWM $DJI

Here we are back again with another weekly look at the US Markets. SPX has rallied off the panic lows from Christmas Eve (which was called for) and is sitting right at 2600 resistance. The Outlook is neutral with a Besrish bias…
You can see the clear resistance lines of 2600 AND 2680. This resistance goes all the way back to 2017 and should be noted. IF you missed the first chance to sell at 2900 and then the break of 2760 then here is yet ANOTHER chance to sell.
The largest rallies happen in BEAR MARKETS, and do not let the

Perhaps the best performing Crypto this week…

…I am speaking about TRON [TRX], which, despite the polemic created lately for the declarations done by a Former Director of the TRON Team, TRON has managed to grow from 300 to 846 satoshis in just 15 days…

Personally, after this great “campaign”, I have decided to sold part of my TRON stake, maximizing my BITCOIN benefits :-)… Following the “Money Flow”, TRON is falling towards the 61.8 FIBO level very rapidly… However, I would expect a deeper correction…

An Interesting Level for considering a new entry is 515 Satoshis . Will see.

Enjoy!

Bitcoin and EOS Technical Analysis: WEEKEND UPDATE

Bitcoin is consolidating right on top of the $3,600 support zone. Should price decisively break below $3,600, the next relevant area of support is between $3,400 and $3,250.

In my last EOS update, I pointed out the larger wedge it was consolidating in. I told you it would likely make a larger move as EOS approached the apex. The following day, price broke down from $3.00 to as low as $2.30. It then sightly rallied to the $2.45 support zone. EOS continues trading around $2.45 at the time of writing this update.

In today’s video analysis I discuss, where prices may be

Crypto Contest January 12: Status

Status (Bittrex: SNTBTC) has broken out of the triangle pattern in the weekly chart.

(Chart courtesy of Tradingview.com (log scale))
Elliott Wave Analysis
In Elliott Wave terms, Status began a wave one advance in December 2017. The red wave one (blue sub-waves i-ii-iii-iv-v) finished in January 2018, and the red wave two (blue sub-waves a-b-c) correction ended in December 2018. If this wave count is correct, Status should be heading next towards the January 2018 peak in the red wave three.

(Chart courtesy of Tradingview.com (log scale))
Funnymentals
Status is an open source messaging platform and mobile interface to interact with decentralized applications that run on
