Crypto (Led by Litecoin) $LTC Continues Grinding Higher

It has been a long time coming, but you can see each day Litecoin continuing to lead this move higher. I mean barring any exchange hack, there is about a 90% chance crypto spikes here IMO. About a month ago I wrote that $50 LTC was pretty much a given with that igniting bar (https://mentormarket.io/cryptocurrencies/heyimsnuffles/i-mentioned-yesterday-ltc-litecoin-will-lead/ ). It has held this ever since and is continuing higher.

There is ZERO reason to be selling crypto right now unless you need to pay for medical service or put food on the table ( and food is questionable) Next target will be $65
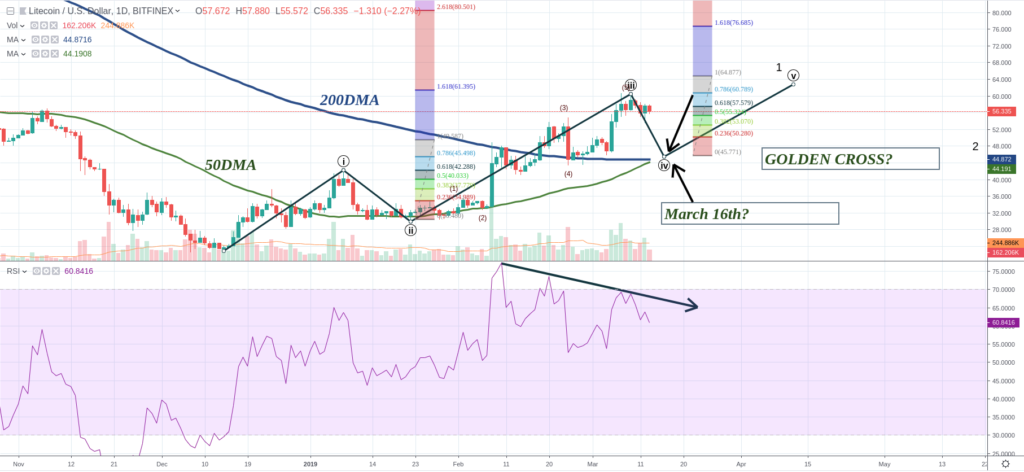
LITECOIN: a Bearish Divergence knocking on the “Golden Cross” Door

Market is keeping its boring steady state movement as BITCOIN does
while altcoins seems going back and forth alternatively day by day…

Well,
not all of them, major altcoins as BINANCE are really independent from
this behavior, In the case of BINANCE I am keeping my bullish sentiment
constant.

Also LITECOIN has demonstrated a very
interesting rise, not related to the Crypto King, BITCOIN, but,
unfortunately now I am obliged to tell you what I see in its chart which
is not bad but very necessary in order for LITECOIN to keep a proper
and sustained growth.

Where is LITECOIN now?

It is, as

LITECOIN: one more push up before correction

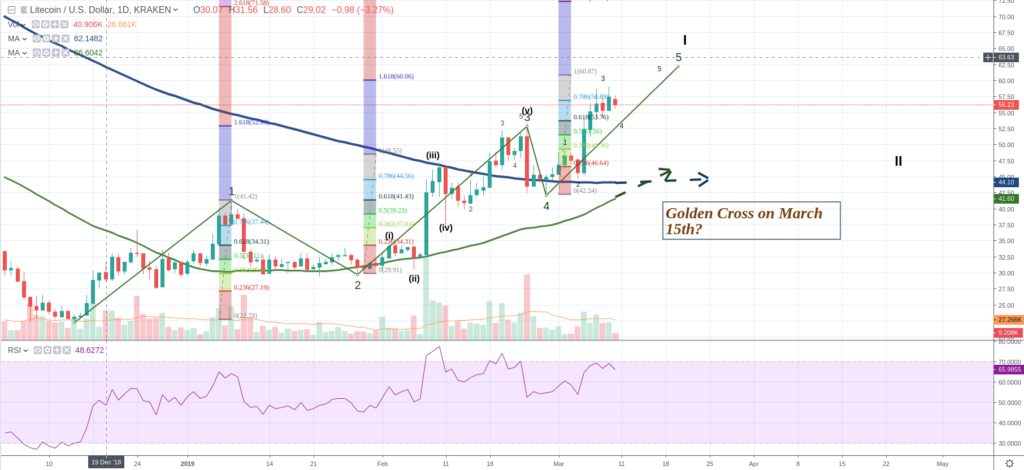
LITECOIN is following the expectations regarding  “Money Flow” also according to the Elliot Waves Theory. 

LTC/USD Trading pair is of course very related with how BITCOIN  does, as any other altcoin but, in the case of LITECOIN, it looks to me that this market is much less manipulated, with less artificial movements driving the price action…

The following is the Chart on which I sketched the waves, FIBO levels and 50/200 Day-Moving Averages:

As you can see, LITECOIN is very close to get
the crossing of both, 50 and 200 Day Moving Averages, which, in my
opinion, will confirm the REVERSAL

Recap of Crypto Chart Reviews on the Scaredy Cat Investor Show

Today on the scaredy cat investor show we reviewed the price charts of steem, litecoin and bitcoin.
Let’s recap what was covered and the outlook we came too.
Relative Strength
Litecoin is showing the most strength among the three and possibly among all crypto.

Looking at the litecoin chart you can see several good things happening:

Price broke the 200 day moving average and then confirmed the breakout with a test before moving higher again.
We are now testing the resistance in that $50-51 area after making a higher low.
The upside potential is large if price establishes above the $51 are as the next true resistance

BNB, LTC and EOS: three major cryptos leading the rise

I have been talked about this 3 cryptos since weeks ago already.

These three are the most bullish cryptos right now among the major ones.

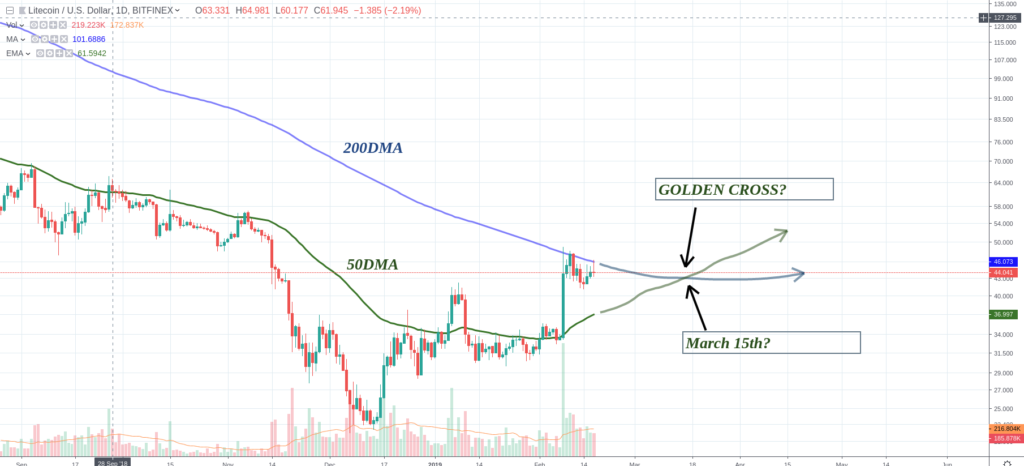
Their approach to the “GOLDEN CROSS” or the cross of the 50 Day Moving Average through the 200 Day Moving Average was so clear to happen in the short time that I already estimated the dates for this event to happen just by extrapolating both trends.

In the case of BINANCE COIN [BNB], It accomplished the prediction as I expected on March the third:

BINANCE may have completed already 5th wave up and so, the 1st big wave

I mentioned yesterday… $LTC Litecoin will lead!

Litecoin is rocketing higher after holding above the 200 day MA here this morning. I mentioned yesterday that LTC may be A LEADER. Not THE LEADER, but A LEADER.

This morning it is CLEARLY the leader across the crypto board regarding % increase in the rankings. The chart looked the best as LTC was holding much higher gains compared to the others and it is showing this relative strength right now.

Don’t sit around and wait…the train is leaving the station baby!

Litecoin Chart Looking Better Than Most

Have to give it to litecoin (LTC), its price performance is definitely showing strength relative to the market.
Importance of Relative Strength
I talked about this a bunch sometime back, it was a period of time when Ethereum was showing relative strength compared to bitcoin and crypto on a whole.
Sure enough, when the market had it’s next push higher ethereum was one of the best performers.
As I sit here present day I wonder if the same fate is in play for litecoin.  Granted, we need the market to gives us a move higher to find out, but litecoin is certainly setup to

LITECOIN: How far from the “Golden Cross”

For those who do not know, the “The Golden Cross” is a Candle-stick pattern which indicates a long-term Bull Market going forward. It occurs when a short-term moving average crosses over a major long-term moving average to the upside and it is very used by investors, analyst and traders as an indication of a major…
Read on Trybe

LITECOIN: How far from the “Golden Cross”

For those who do not know, the “The Golden Cross” is a Candle-stick pattern which indicates a long-term Bull Market going forward. It occurs when a short-term moving average crosses over a major long-term moving average to the upside and it is very used by investors, analyst and traders as an indication of a major…
Read on Trybe

LITECOIN: How far from the “Golden Cross”

For those who do not know, the “The Golden Cross” is a Candle-stick pattern which indicates a long-term Bull Market going forward.

It occurs when a short-term moving average crosses over a major long-term moving average to the upside and it is very used by investors, analyst and traders as an indication of a major upward turn in a market.

Normally, the two moving averages used are the 50-Day MA and the 200-Day MA.

When the 50 DMA crosses the 200 DMA to the upside this is called GOLDEN CROSS…. Worth to say that also the contrary would indicate that the Bear Market is