Cryptos Look to be Bouncing Off Support

Though it’s still a bit early, many coins look like they are bouncing off the support levels they pulled back to the past week.
Let’s take a quick look at a couple of them…
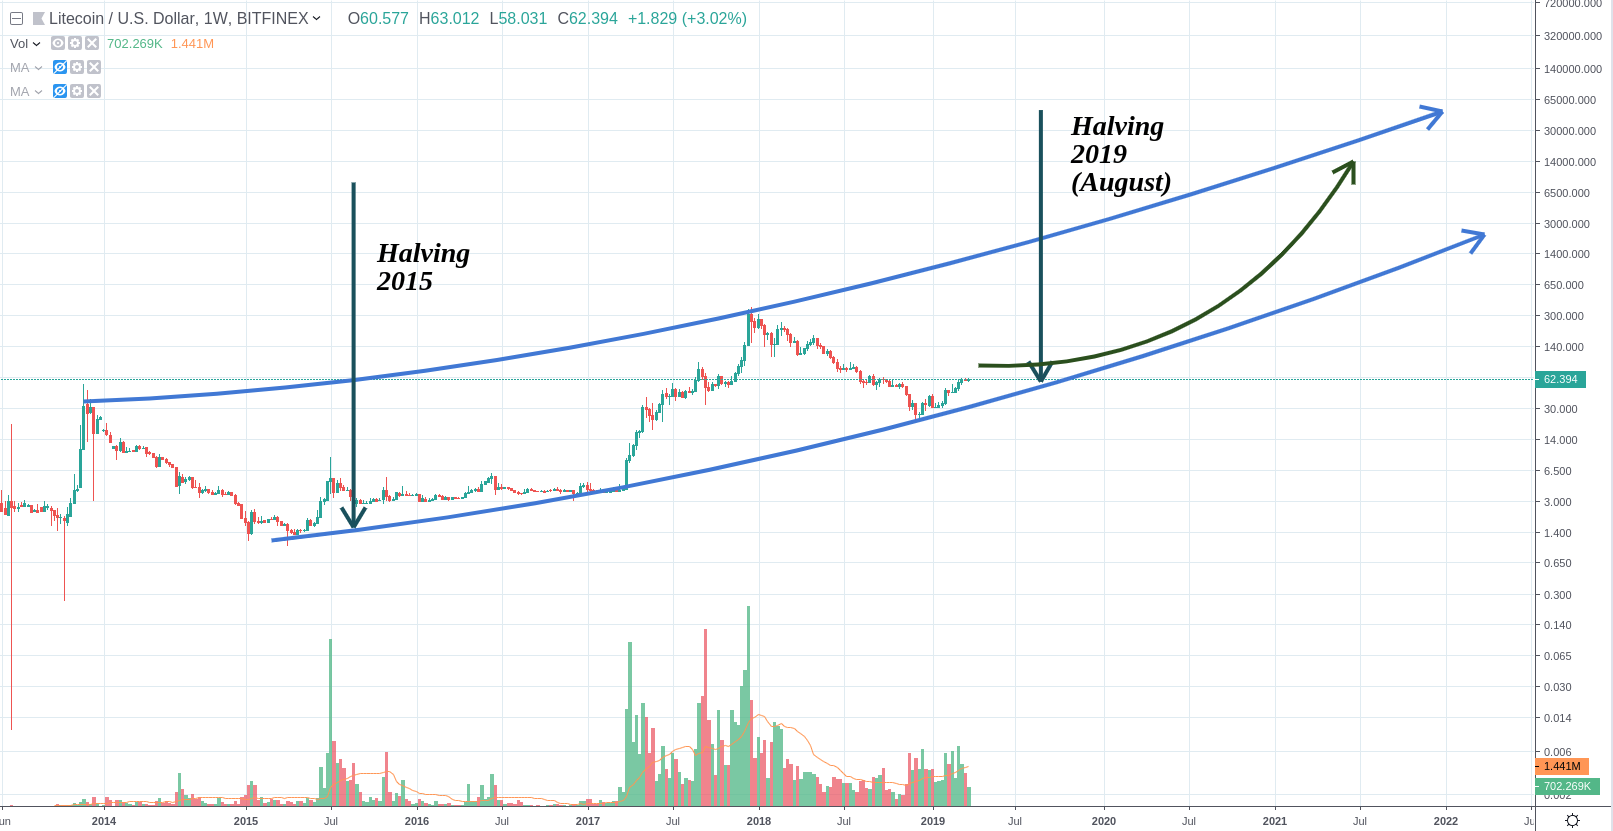
Litecoin Looking Orderly

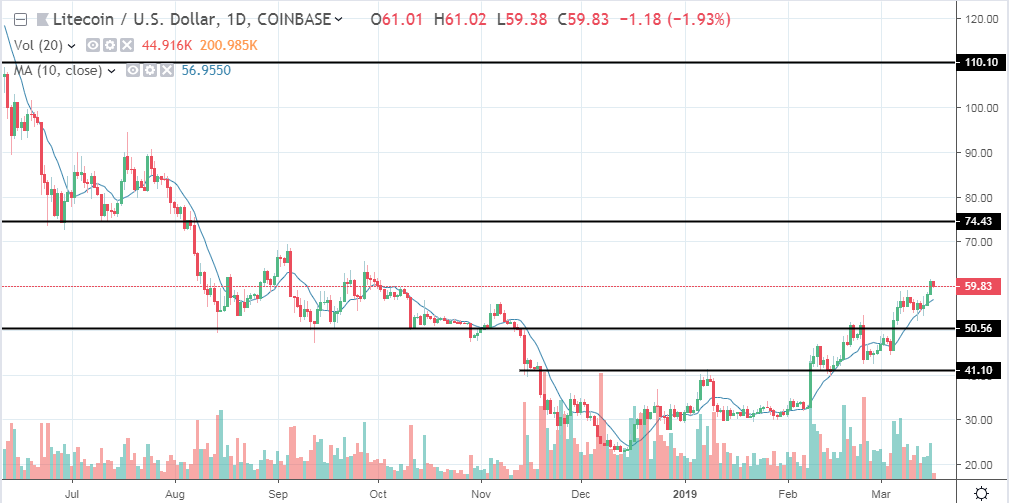
Looking at the chart of litecoin in the daily timeframe you see it pulled back to the first level support target, which was the prior resistance.
This is a confirmation of the break and bodes well.  However, I will feel alot better about it if price can push to the previous top at $100.
In the end – if it just consolidates sideways that would still be fine

Litecoin Price Analysis – Let the Retest Commence!

Here it is folks, it was somewhat expected and is now in the midst of occurring.  I’m ore than okay with this as I like orderly price progression.
Litecoin Testing Prior Resistance as Support
Looking at the chart we saw litecoin smash through the $74-75 level and push almost to $100.  However, odds were we’d see a pullback and maybe even a retest of this level, especially considering how long it had been since we were at these levels.
So that is what’s now taking place.  Big red candle that closed today and so far the new daily candle is red too.
Price got

Litecoin Strength Is showing the Way

Relative strength is so important in analyzing bullish and rising markets. Crypto is no different. I am looking st the assets that led us off the bottom which is mainly Litecoin and EOS. Litecoin is the strongest member of the major crypto assets and looking st the chart I have to admit the grind looks ripe.

You can see the igniting bar and constant higher lows and grinding towards highs. I believe you are going to see this back to highs coming out of this small base here.

The trend is your friend, and this is just beginning.

Litecoin is Smashing Towards $100

The magnet is there now folks. The $100 magnet will commence and likely at least make someone pay this on this leg up. I have seen crazier things happen, so I would not be completely surprised if it blew right through it again. (I do not think it does on the first test).

The relative strength from LTC has been present for months and have been highlighted in multiple of my posts over the last 8 weeks. and it has proven once more, relative strength WINS AGAIN. LTC has ripped in 48 hours from 60 to 90+ up over 50%.

Litecoin Quietly Consolidates Before its Next Move

Looking at the litecoin chart a couple of things jumped out at me.
1.) The Declining Volume for the Month of March
2.) It consolidating sideways around $60, which is where it ran out of steam after the last move up.
Looking at the chart in this post you can see I noted the volume on the bottom right side of the chart with an arrow.
See how it has been drying up as March went on?
I’m not saying that is necessarily a bad thing, in fact I don’t mind at all that we are consolidating on light volume.  Sometimes that just means the

LITECOIN: Pull back expected and Next Halving

Litecoin has had an amazing rise lately, however there are signs of Bulls exhaustion these days.

By
one side, LITECOIN seems to have completed the 5 waves rise in a very
consistent manner, by the other, Volume has decreased dramatically with
each Higher high, which is again a sign of exhaustion.

Also, as I said a few days ago, the “relative Strength Index” shows a clear downtrend.

Both, volume and RSI seem to indicate a clear “Bearish Divergence” here, so, why not taking advantage of this situation?

Looking for a good entry point I would choose 0.618 FIBO retracement Level as the more likely

Bearish Divergence on LITECOIN and BINANCE?

Following the last movements of BITCOIN on which we are
currently experimenting a drop on the price, we can see some signs of
“exhaustion” in the rise of some of the major altcoins that have led the
rise lately.

This is the case of LITECOIN and BINANCE Coin.

On LITECOIN:

we can be very satisfied of its performance, it has completed 5 waves, forming a promising 1st one in black. The price has grown constantly from 24 to 64 USD in the last 3 months but, unfortunately, the RSI  seems to indicate a clear DIVERGENCE on the rise of the last three Highs…

If

The Litecoin Relative Strength Continues (Technical Lesson) $LTC

I said a few weeks ago in multiple posts that I was expecting LTC to lead us off the bottom. From that igniting bar in early February you can see the strength all the way up and even today. I am going to teach you a lesson of Relative Strength. Check out the chart below.

You can see the igniting bar and the trend that started. Notice on the RSI indicator at the bottom how LTC continuously gets “overbought” (RSI>70) and NEVER gets “oversold” (RSI

Litecoin: where should you sell?

It’s been a good quarter for LTC: ever since mid December 2018 LTC has been gaining on BTC. But since we know that what goes up must come down; where/when should we sell our LTC?

The current LTC climb is a strong one. I say this because LTC is typified by short, sharp price climbs and long, slow price falls thereafter. The current climb is slow and steady, which leads me to believe that it may be a particularly strong one. (See the CMC chart below):

From https://coinmarketcap.com/currencies/litecoin/

Because this climb is looking particularly strong, it is my suggestion that you sell LTC

Litecoin Still Outperforming the Market

Relative strength is something I speak about often and with good reason!  When a crypto is acting stronger than the broader market, what do you think will happen when the whole market catches a bid?
Litecoin Not Pulling Back Like The Rest
If you look at the chart in this post you can see the positive price action Litecoin has had in recent months.  Higher highs followed by higher lows consecutively.
Over the past week other alt coins that made a run have pulled back, but litecoin has mainly held steady with just a red candle today after a very shallow pullback if