LITECOIN: How far from the “Golden Cross”

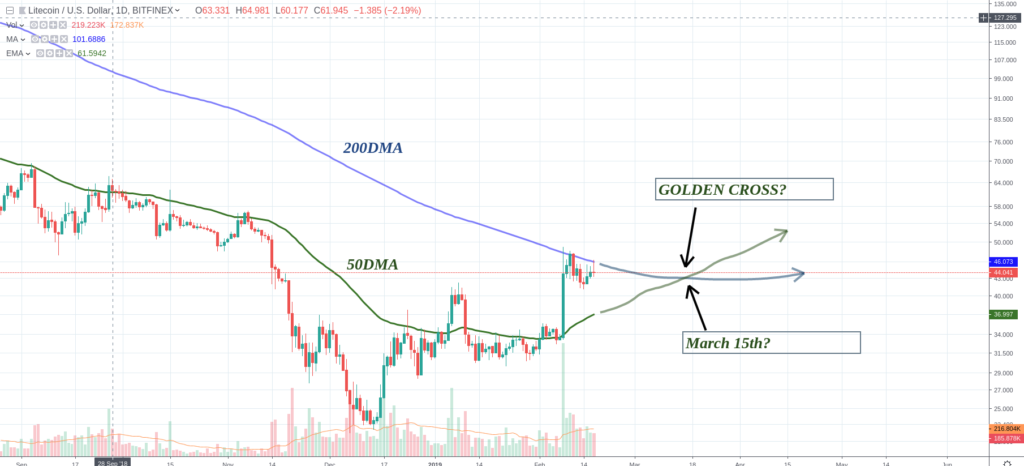
For those who do not know, the “The Golden Cross” is a Candle-stick pattern which indicates a long-term Bull Market going forward.

It occurs when a short-term moving average crosses over a major long-term moving average to the upside and it is very used by investors, analyst and traders as an indication of a major upward turn in a market.

Normally, the two moving averages used are the 50-Day MA and the 200-Day MA.

When the 50 DMA crosses the 200 DMA to the upside this is called GOLDEN CROSS…. Worth to say that also the contrary would indicate that the Bear Market is

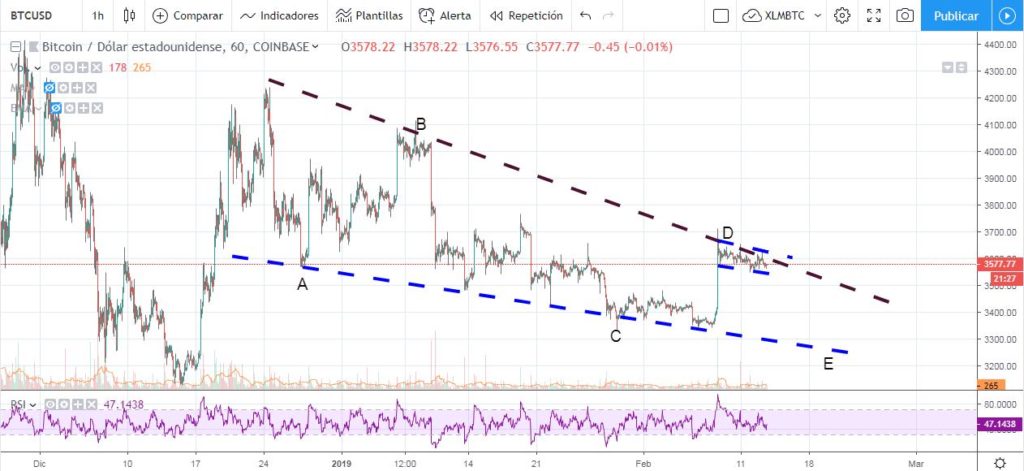
BITCOIN: testing the Upper trend-line

8 days have passed already from the last rise and the market seems reacting extremely stable.

Total Market cap blocked around 121 b$ and no signs of pump-dumps around… Thought this is good, some stabilization is needed for the market in order to recover the investors confidence.

The last few hours we have noted a shy change of trend, slightly upwards which is good because BITCOIN may complete the 5th wave if it manage to break the upper trend-line of a long bull flag.

If so, 5 small subwaves would form this last 5th wave. Applying some FIBO levels we could envisage 3722

Diversify!

I often shout “Diversify!” when I speak about crypto, I even wrote a few posts specifically on that topic. I’m known for keeping a ridiculously over-diversified crypto portfolio that’s not very easy to track and manage (we’re talking way in excess of 50 cryptos here).

But is that all there is to diversification? Hold a lot of different cryptos – spread the risk and maximise the chances of finding something with good ROI – sell the ones that Moon and buy cheap (good) ones in their place?

Well – yes. That’s pretty much exactly what you should do.

Made by Bit Brain. Yes

BITCOIN: either a “Bull” Flag or “BART” Flag

A few days have gone since I have posted about BITCOIN and , to tell you the truth, I felt like it did not deserve to do so till now.

Market is in “consolidation” mode, trying to decide which way to take now and the volume has kept constant since almost 5 days ago, stuck around 6.5 b$ which is not bad since it was 5b$ just a week ago…

As expected, BITCOIN has been dancing and still is doing so just below the upper line of the falling wedge.

It is true that 5 days ago I expected a continuation of the

Bitcoin and EOS Technical Analysis: BREAKOUT LOOMING?

Bitcoin continues to consolidate, but is showing numerous signs of a possible breakout. I discuss this further in my video analysis at the bottom.

EOS has been trying to break above the $3.00 resistance. While it’s briefly penetrated by a wick, a decisive break above has been unsuccessful. Volume has been slowly rising and, like bitcoin, we are seeing signs of a possible breakout in the near future.

In today’s video analysis I discuss where prices may be heading, traps to avoid and so much more. I hope you find it helpful.

Video Analysis:

If you don’t see the above video, navigate to TIMM

Latest BTC prediction holding strong

A prediction of mine from 8 Feb is right so far.

I published it in my Fib levels post of 10 Feb. I might as well milk it for all it’s worth while it remains correct!

This is the chart I’ve been using – the arrows are unchanged since I first drew them.

Made by Bit Brain with TradingView

Why am I showing you this now? To demonstrate how good I am? No – that’s not it. Okay, that is it a little bit, but there is more to it than that!

There is much excitement in the crypto world at the moment. People

Bitcoin Technical Analysis: QUICK UPDATE

Bitcoin broke below the $3,600 support (on Coinbase). It’s now testing the prior order block between $3,580 and $3,540. Should this break down decisively (4hr candel opening and closing below), I believe a drop to $3,400 will become likely. Looking at the 4 hour chart, we can see the 8, 21 and 55 day EMA’s…
Read on Trybe

Bitcoin Technical Analysis: QUICK UPDATE

Bitcoin broke below the $3,600 support (on Coinbase). It’s now testing the prior order block between $3,580 and $3,540. Should this break down decisively (4hr candel opening and closing below), I believe a drop to $3,400 will become likely.

Looking at the 4 hour chart, we can see the 8, 21 and 55 day EMA’s are converging with the 50 and 200 day MA. The Bollinger bands are also bottlenecking. This suggests a larger move may be coming in the next 24-48 hours.

In today’s video analysis I discuss where price may be heading next, traps to avoid and so much more.

Crypto Shopping Cart 12 February

I’ve been shopping (again). I like to publish these posts so that you can see if I follow my own advice or not.

This is a rather interesting shopping excursion…

From http://www.pexels.com

Funding the buys:

I finally have some fiat available for crypto, but as is said in “BTC – Trade the channel” it’s all still sitting on an exchange locked up in buy orders – none of which have triggered yet. Thank you very much recent BTC price spike.

I have no intention of raising the prices of my BTC offers. Yes I am DCAing back into BTC, but it’s a modified DCA

CargoX – if you haven’t heard of it – you need to read this!

I haven’t done a CargoX post since I posted this one from my phone while on vacation in early January.

It took me quite a while to remember that I published that directly on Steemit (I’m not even going to attempt to use WordPress through an old phone), I was looking everywhere on my TIMM site for it!

Regular readers will know that I am a big CargoX (CXO) believer. Search the STEEM blockchain for “bitbrain cargox” and you will see… Today I just want to remind you that it is still alive and well and that it is very very cheap!

All